Most cryptocurrencies are still battling the effects of the bearish shake the market last month. They have been unable to recover and are down by a few percent as of the time of writing. Nonetheless, a lot in terms of price movement happened during the past 30 days.
One such is the decline in the value of the global cryptocurrency market cap. It started the period under consideration at $1.2 trillion and peaked at $1.27T as some projects experienced little uptrends.
The sector’s valuation dipped below $1T on the 13th day of June. This was the first time receded to that level in more than a year. Following the retracement, the industry continued its downtrend until it rebounded at $792 billion.
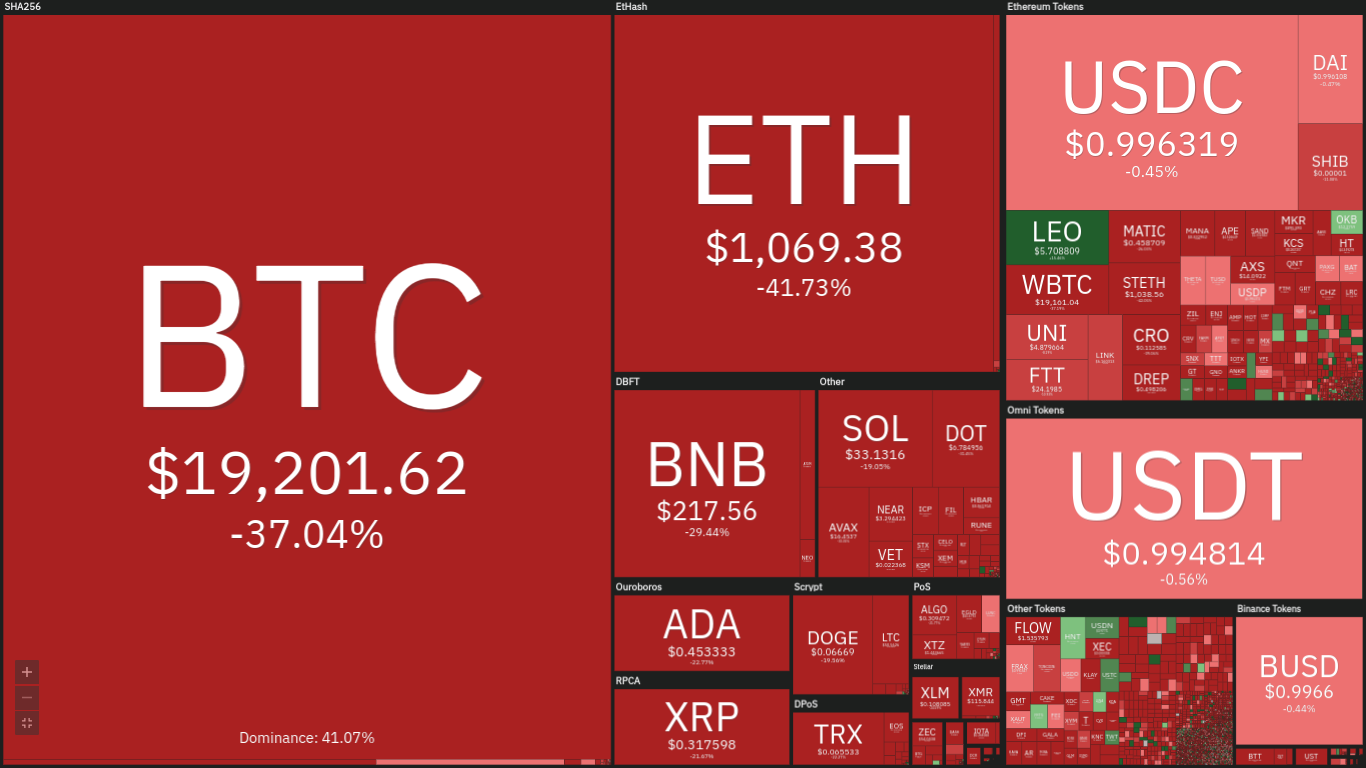
It is currently worth $867 billion which signifies a more 20% loss. The image below sheds more light on the state of some prominent projects after the dips.
Source: Coin360
From the above image, we observed that most cryptocurrencies have lost a notable piece of their value. One such is Avalanche as it lost more than 35%. Other projects have also lost the same amount and it is hard to pinpoint the top loser.
Nonetheless, one of the top gainers over the last 30 days is LEO. The token gained more than 9% during the period under consideration. Looking ahead into the new months, will market conditions get better or will it get worse? Here are the top five cryptocurrencies to watch this July.
Top Five Cryptocurrencies to Watch
1. Bitcoin (BTC)
It’s not hard to conclude that the largest cryptocurrency by market cap had one of its toughest runs last month. The image above shows the dwindling dominance and the effect of the consistent drop it experienced.
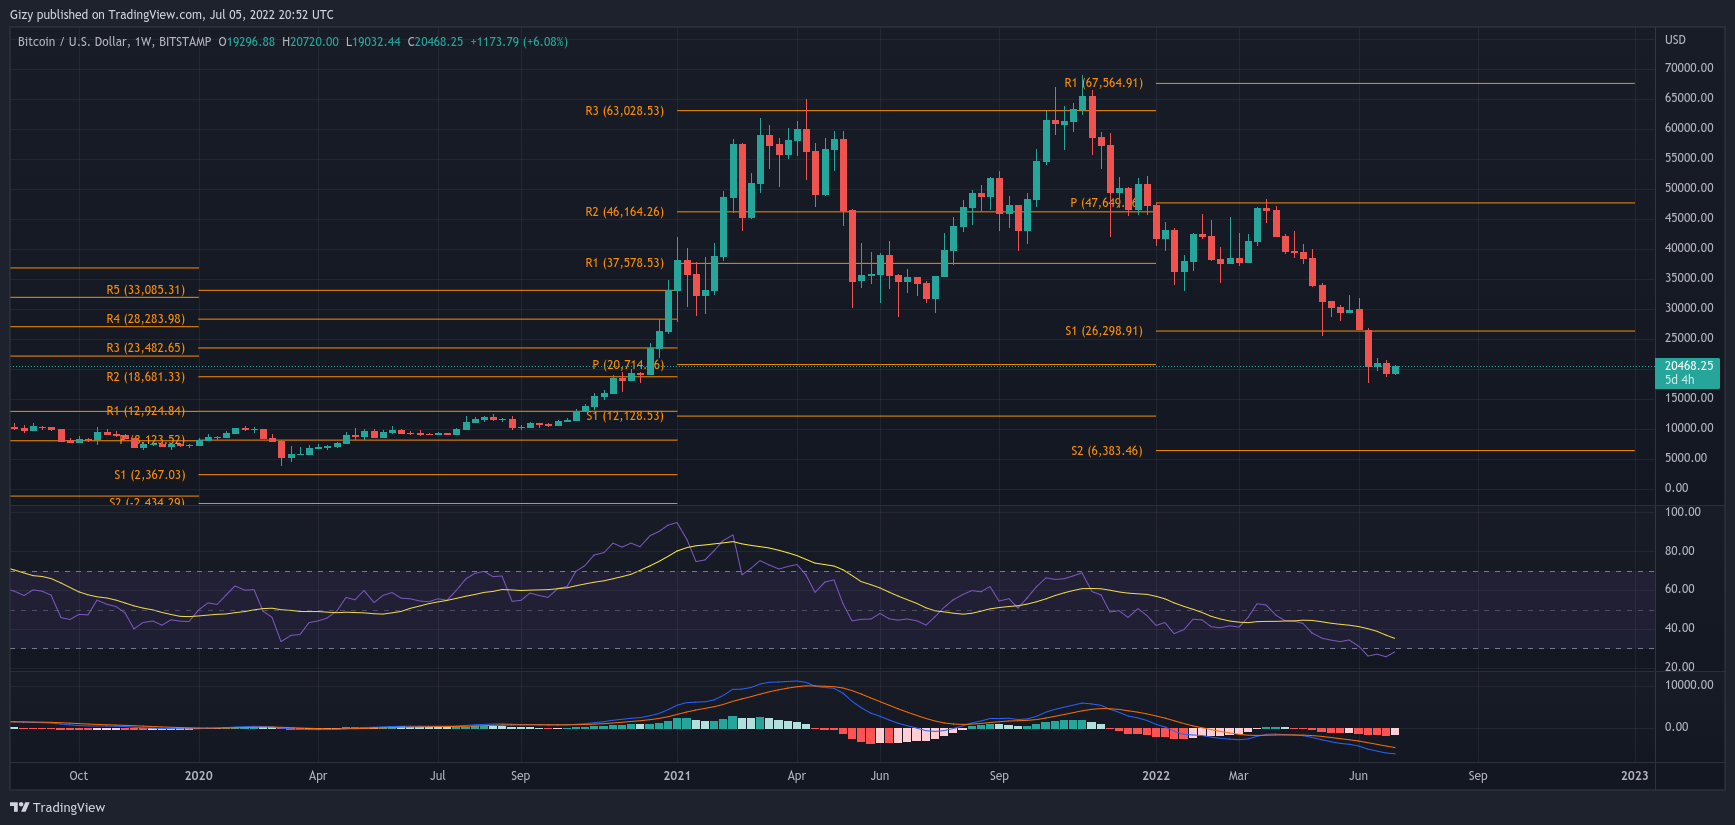
The first five days of July were a little bullish as BTC recorded gains during this period. The downtrend started during the second week as it peaked at $31,731 but was met by retracement. It was sent crashing down and flipping critical supports on its way.
One such is the $30k and then $28k support. They stood no chance as the selling pressure outweighed the buying push by a large margin. That seven-day period ended with the apex coin losing 11% and closing at $26,500.
The next intraweek session had more severe conditions for the bulls. As it began, it faced an immediate correction that lasted throughout the seven days. More positive barriers buckled under intense congestion.
One such is the $22k and later the $20k support. Following the flip of the said barriers, more selloffs hit the market and BTC was sent below $20k. It rebounded at $17,592 and closed the week above $20,000.
The last seven-day period saw the top coin gain a few percent but could not be as significant. On the part of indicators, they have all turned bearish. During the second week, bitcoin lost its first pivot support on the weekly chart.
We also the Moving Average Convergence Divergence dips more below 0 which corrolates with the Relative Strength Index. As at the time of writing, the apex coin is oversold. What does this month hold for it?
There May be More Downtrends
Last week, bitcoin started a downtrend and is yet to recover. As a result of the downtrend, MACD is blaring warnings. Aside from that indicator, RSI is trending a little above 30 which puts BTC in a very dangerous position.
An increase selling pressure could send the below 30, becoming oversold. This may also trigger a bearish divergence on MACD. This means that the apex coin may be in for another bearish round.
One of the levels to watch is the $17k support. There are several indications that bitcoin may record a deeper low during the continuation of the winter season.
2. Ethereum (ETH)
Ethereum also suffered increased selling pressure last month compared to the previous 30-day period. Like most cryptocurrencies, it started the period under consideration with notable losses. One such was on the first five days when it retraced below $1,800.
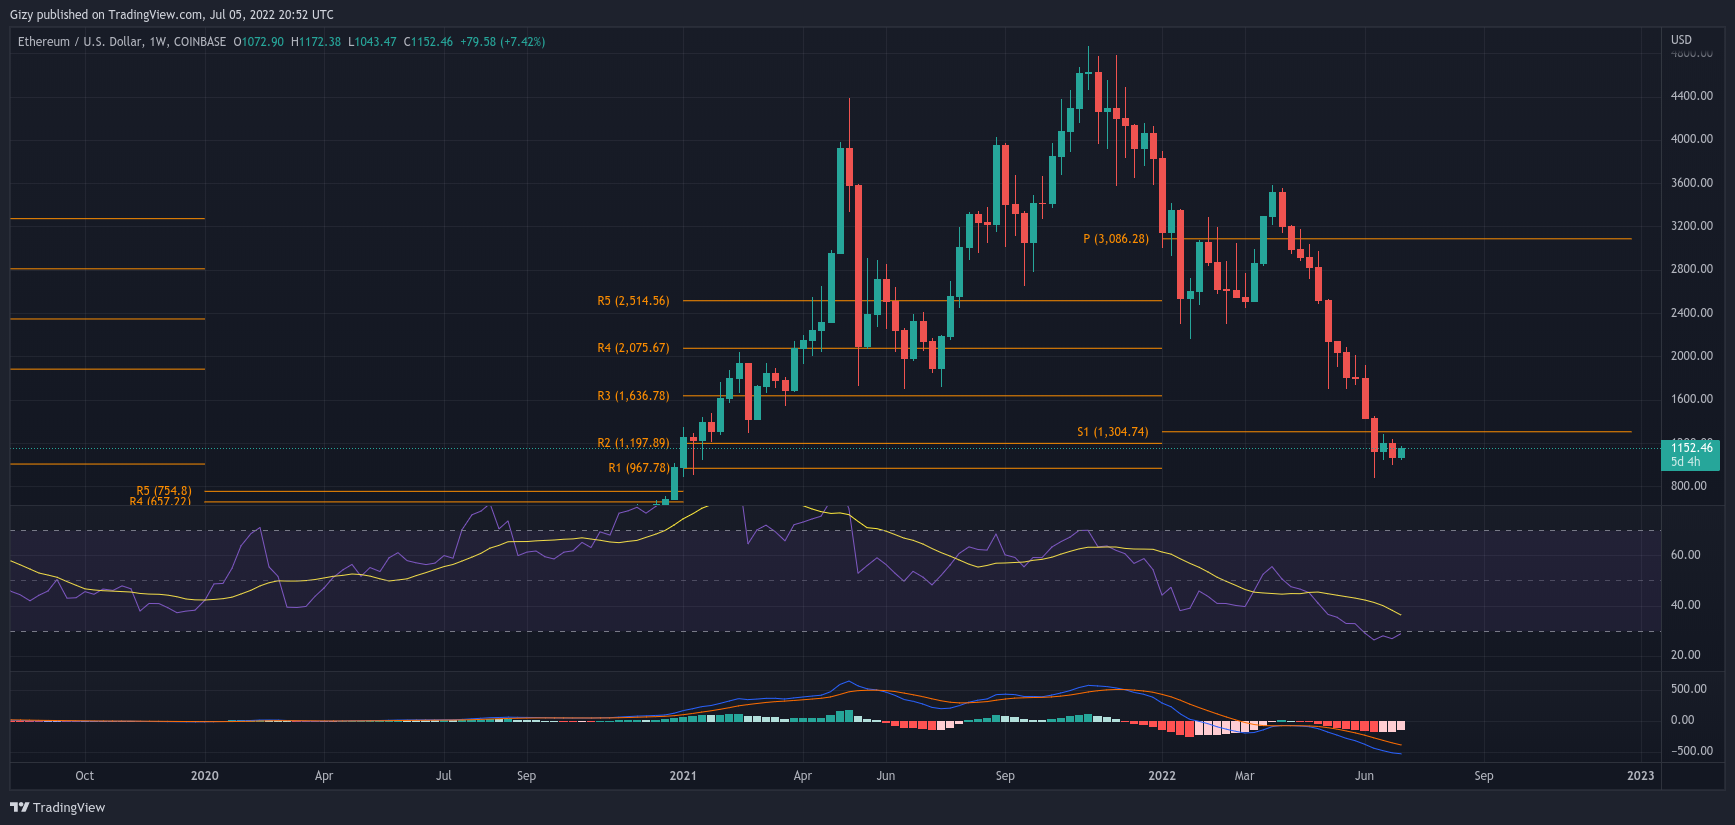
Although the session was marked by a doji, it marked a bad beginning for ether. The next intraweek session came with increased selling congestion. The coin showed a lot of potention at the start as it peaked at $1,918.
Nonetheless, it lost momentum as the week progressed. This led to a close at $1,433, signifying a more than 20% decrease. The next seven-day period was more severe than the previous as ether saw almost ni uptrend at all.
It dipped to a low of $879 for the first time in more than a year. It recovered and closed at $1,126 but could not erase all of its losses as it recorded a 21% deficit. Ethereum also saw some good times during the previous month.
For the first time since the start of the second quarter, the largest alt saw an increase of more than 6%. However, the accumulated gains were lost during the next intraweek session as it retraced below $1,000 and lost 10%.
A closer look at the asset under consideration, we observed that is currently oversold in the weekly chart. This means that it is seeing an unprecedented amount of selling pressure since its introduction to the market.
MACD tells no different story from the Relation Strength Index. Both the 16-day EMA and 26-day EMA are still on a downtrend are below -400. Additionally, ether slopped below its first pivot point.
How Will the new Month Playout?
It remains to be seen as all indicators are still bearish. Nonetheless, there are other indications of possible price actions. One such is found on the daily chart. Based on this, we observed that ether is close to experiencing a bearish divergence.
This means that the largest altcoin by market cap is bound to experience another bearish round. It is hard to know the dept of the coming downtrend. Nonetheless, one key level to watch out for is the $900 support. Both the $800 and $700 supports are open to a retest and a possible flipping.
3. Binance Coin (BNB)
Binance coin is another asset that is on many investors’ watchlists. Like most cryptocurrencies, the month started a bit slow. One indication of this is the candle that represented the first five days.
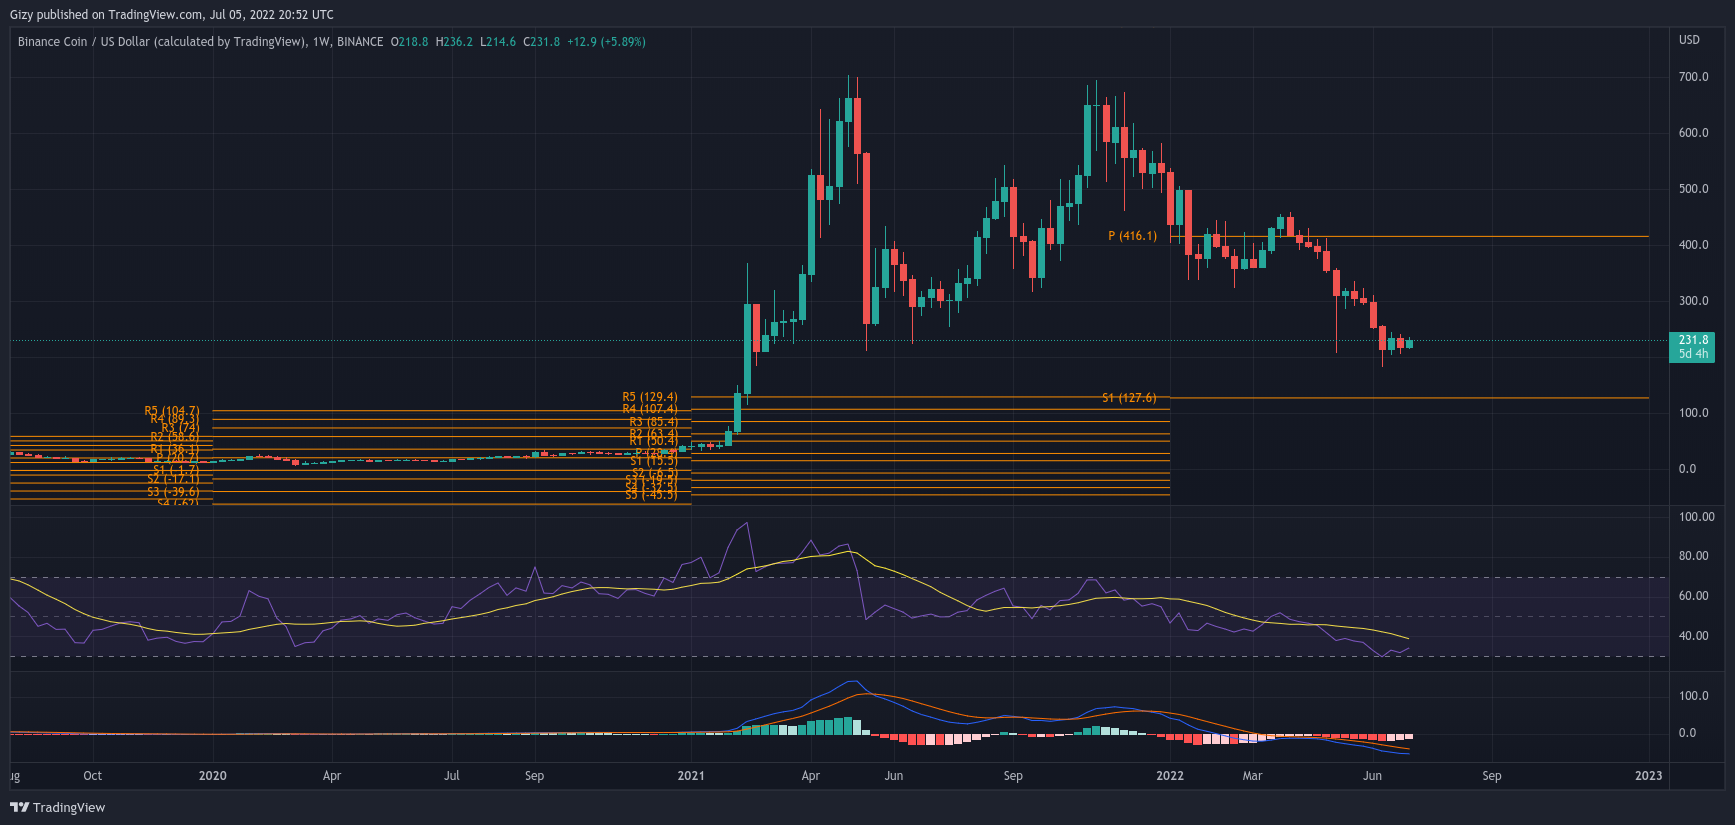
The candle was a red one which indicates that it lost a few percent. However, as the 30-day period progressed the selling congestion increased. During the second week, BNB peaked at $312 but was met by retracement.
This led to a downtrend that saw the altcoin close at $254, signifying a more than 14% decrease. The downtrend intensified during the next seven-day period. One of the main highlights of that period was when the $200 support came crashing.
As a result of the flip, BNB dipped to a low of $183 which was the lowest in almost one year. At the end, it recovered from the retracement but lost more than 15%. The same price increase continued into the next week.
It saw very little correction as it dropped as low as $204. Afterwards, it surged to a high of $245 and closed at $233, signifying an almost 9% increase. Last week, Binance coin lost more than half its accumulated gains.
On the part of the indicators, BNB is yet to retest its first pivot support but is edging to closer to it. Additionally, RSI is at 32, which is one of the lowest in a long while. MACD is also going down as it continues below 0.
What Should Be Expected This Month?
One of the good news that many would expect is that the Moving Average Divergence Convergence has regained its upward trajectory. On the daily chart, this is the scenario. Nonetheless, there are still fears of the exchange token having a bearish divergence.
If this happens, we may expect a retest of the $200 support. It remains to be seen how long such a selling pressure period will last. However, the coin will rebound and start an uptrend afterwards.
4. Solana (SOL)
A closer look at Solana weekly chart shows that it is one of the few coins that enjoyed more price increases. Nonetheless, the first five days of the month were slow as the asset lost more than 10%.
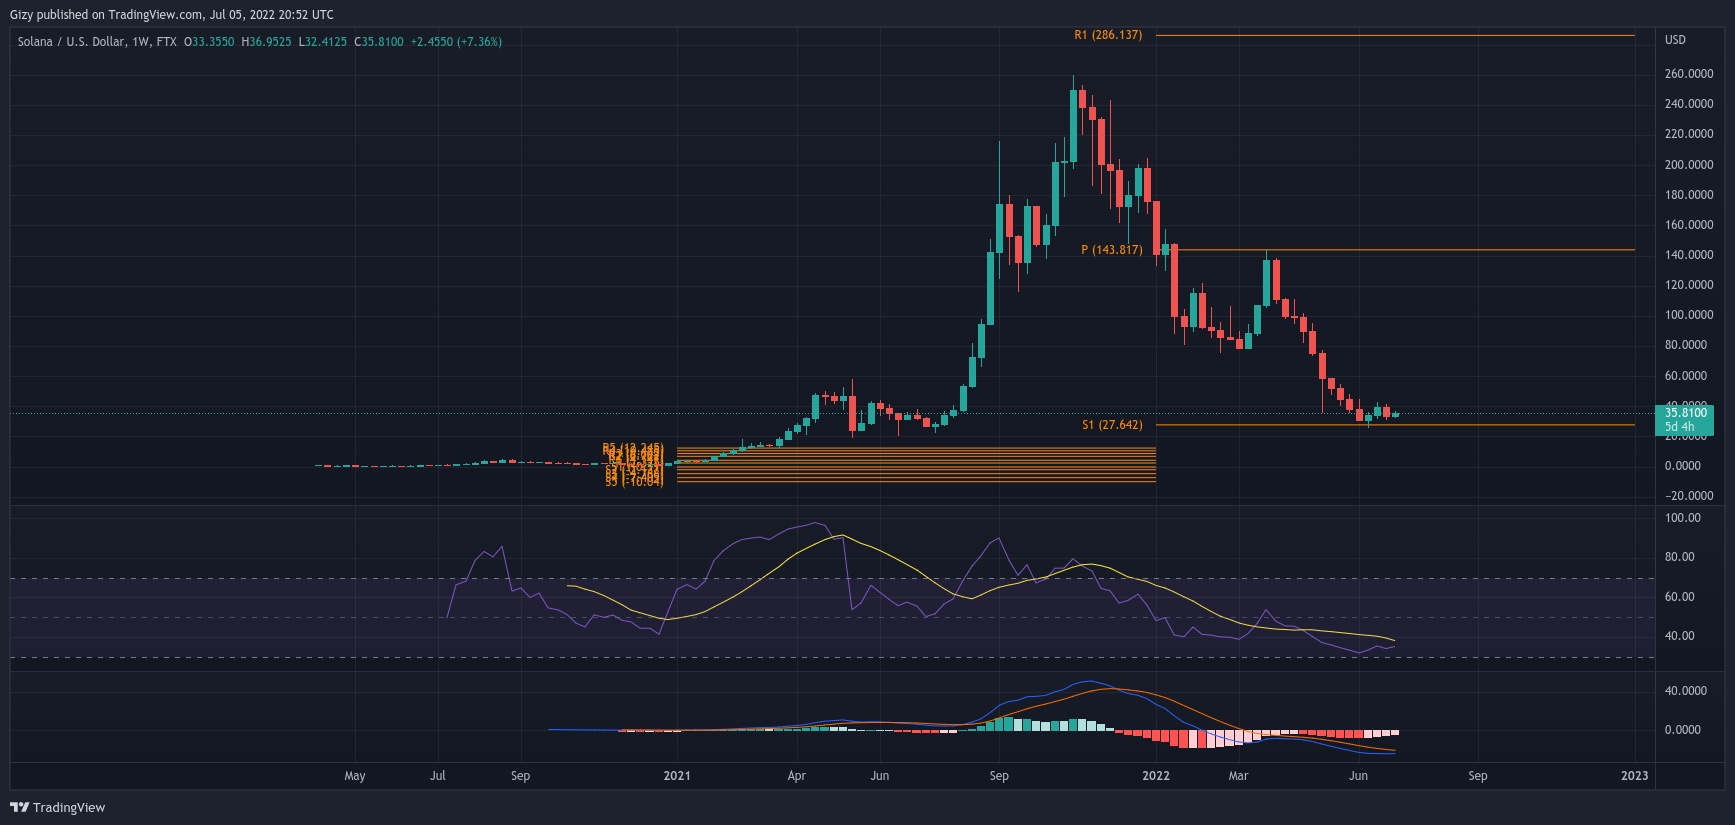
It dipped as low as $35 but recovered and closed at $38. During the next week, SOL peaked at $44 but was met with rejection. After that it dropped to a low of $30 but could not recover which resulted in a more 20% deficit.
During the next intraweek session, solana started an uptrend. Although, the asset lost the $30 support again and hit a low of $25. After a rebound, it surged to a high of $36 but closed at $34 which depicts a more than 11% incease.
The uptrend continues throughout the next week. Nonetheless, the bears recorded a notable victory as the altcoin dipped to a low of $31. It hit support at the level then peaked at $42 but close at $39.
However, SOL bullish run ended two weeks ago as it lost more than 15%. As a result of the two-week uptrend, the asset was not oversold like most cryptocurrencies. The current month has started a lot different from the previous.
If the uptrend continues, the 12-day EMA may intercept the 26-day soon. If this happens, we may expect more price increase in the coming weeks.
Conclusion
This article highlighted five cryptocurrencies to watch this month. The above predictions coming true largely depend on market conditions remaining relatively stable for most parts of the next seven days, which of course is not guaranteed. The volatile nature of the crypto space means investors and traders must do their own research and always keep an eye on the charts
Find Cryptocurrencies to Watch and Read Crypto News on the Go Follow CryptosToWatch on X (Twitter) Now

