Bitcoin led the market recovery in the last three days. However, these attempts at reclaiming lost levels have not been as smooth as many expect, as the apex coin continues to struggle to hold critical levels. The same trend spread across several cryptocurrencies as they are yet to reclaim all lost levels.
Nonetheless, the global cryptocurrency market cap has significantly changed in the last four days. Valuations are almost $2 trillion, as they gained over 7% in the previous 24 hours, and altcoins buoyed the hike. APT is at the forefront, as it gained over 10% within the duration.
News of the Kamala Haris edging in the presidential race has received mixed reactions from the crypto market. It saw notable declines at the initial stages of the event but is holding up despite the odds. According to Polymarket, the current vice president has a 53% chance of winning compared to Donald Trump’s 46%.
Ripple settled its case with the United States SEC and will pay $125 million in fines. XRP saw notable price changes in response. Let’s examine how other assets performed.
BTC/USD
Bitcoin had one of its most significant declines on Monday as it dipped to a low of $48,577 after starting the day at $58,137. The asset saw buyback, closed at $54,014, and registered losses of over 7%. Indicators dropped to critical levels in response.
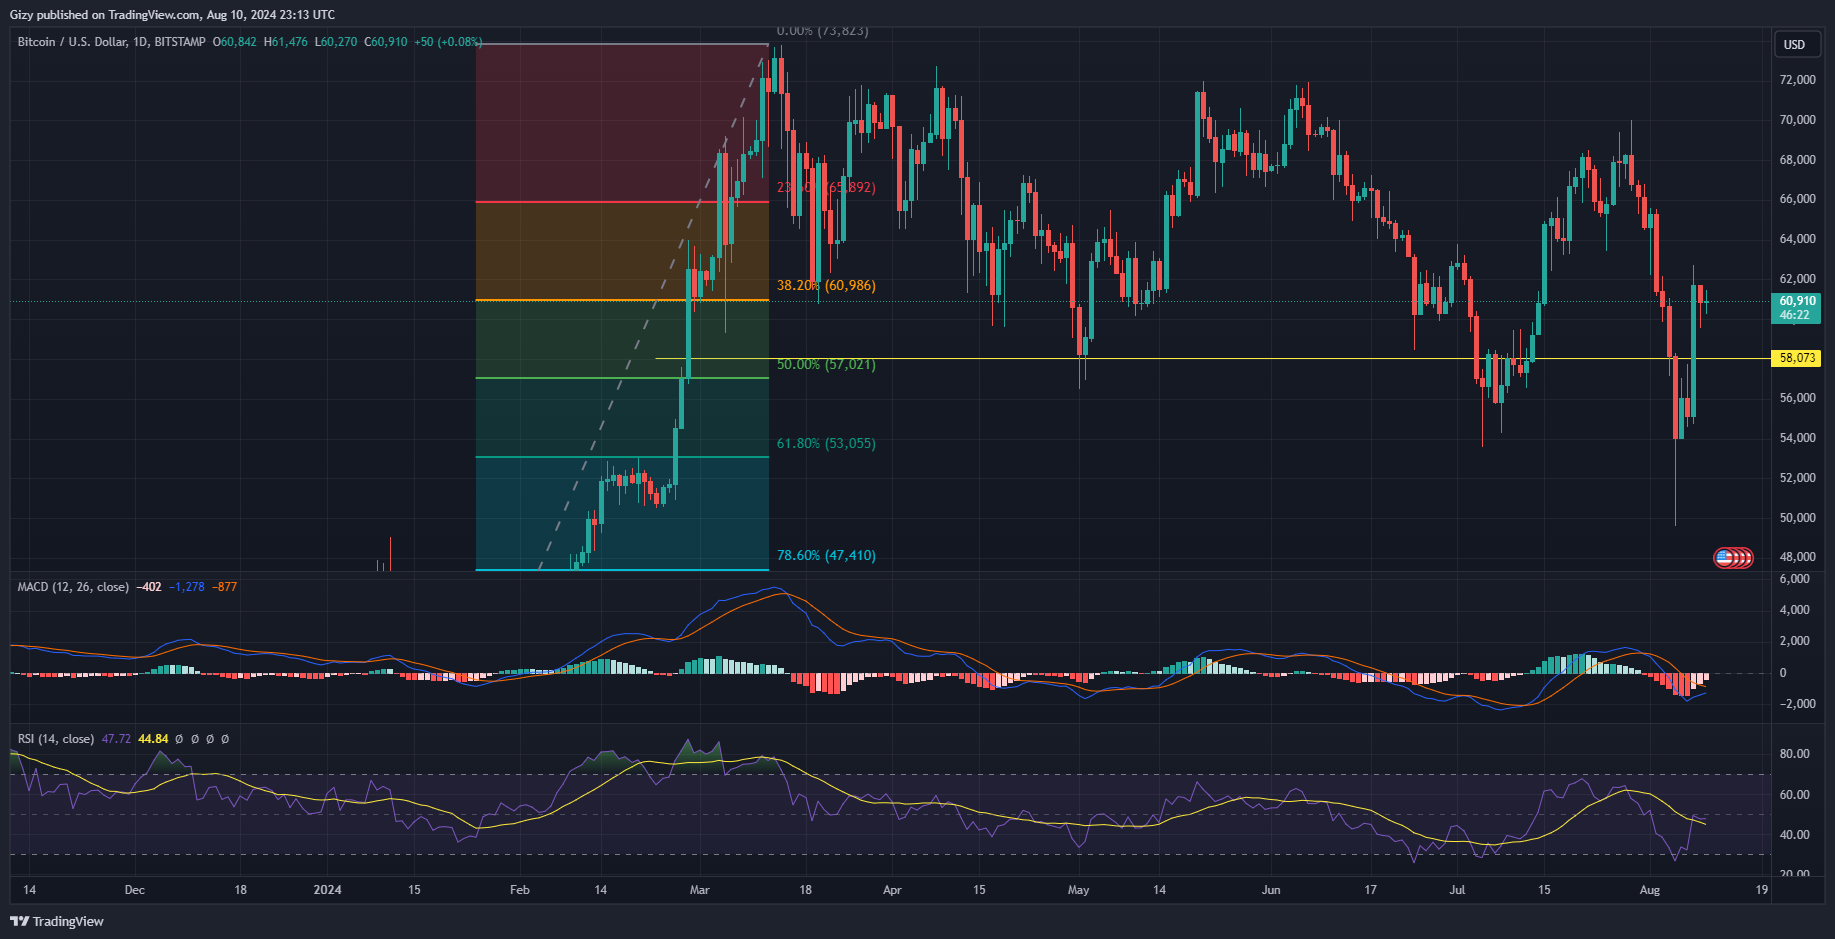
The apex coin has since started to recover from that drop with insignificant success. For example, it surged by almost 4% during the following intraday session. However, it had one of its most significant surges two days ago.
It started trading at $51,132 but registered a massive buying volume, resulting in a notable price surge. It peaked at $62,729 but closed slightly lower and registered losses of over 11%. Indicators are flipping bullish in response.
One such is the moving average convergence divergence, which has an ongoing bullish convergence. The 12-day EMA saw notable improvement and is on an uptrend. The 26-day EMA is still on the downtrend, which may indicate that the apex coin is still negative in the longer timeframe. Nonetheless, the complete interception will result in the improvement of the latter metric.
The relative strength index was below 30 a few days ago but recovered and peaked at 49. The asset has since struggled to keep the buying pressure as it appears the bulls are getting exhausted. Nonetheless, trading actions in the last 48 hours suggest that the coin will be holding the $59,800 support.
ETH/USD
Ethereum was one of the worst hit by the massive price decline. On Monday, it retraced from $2,688 to a low of $2,116. It started recovery but failed to reverse the losses as the bulls caused a rebound that saw it close at $2,402, with losses of almost 10%.
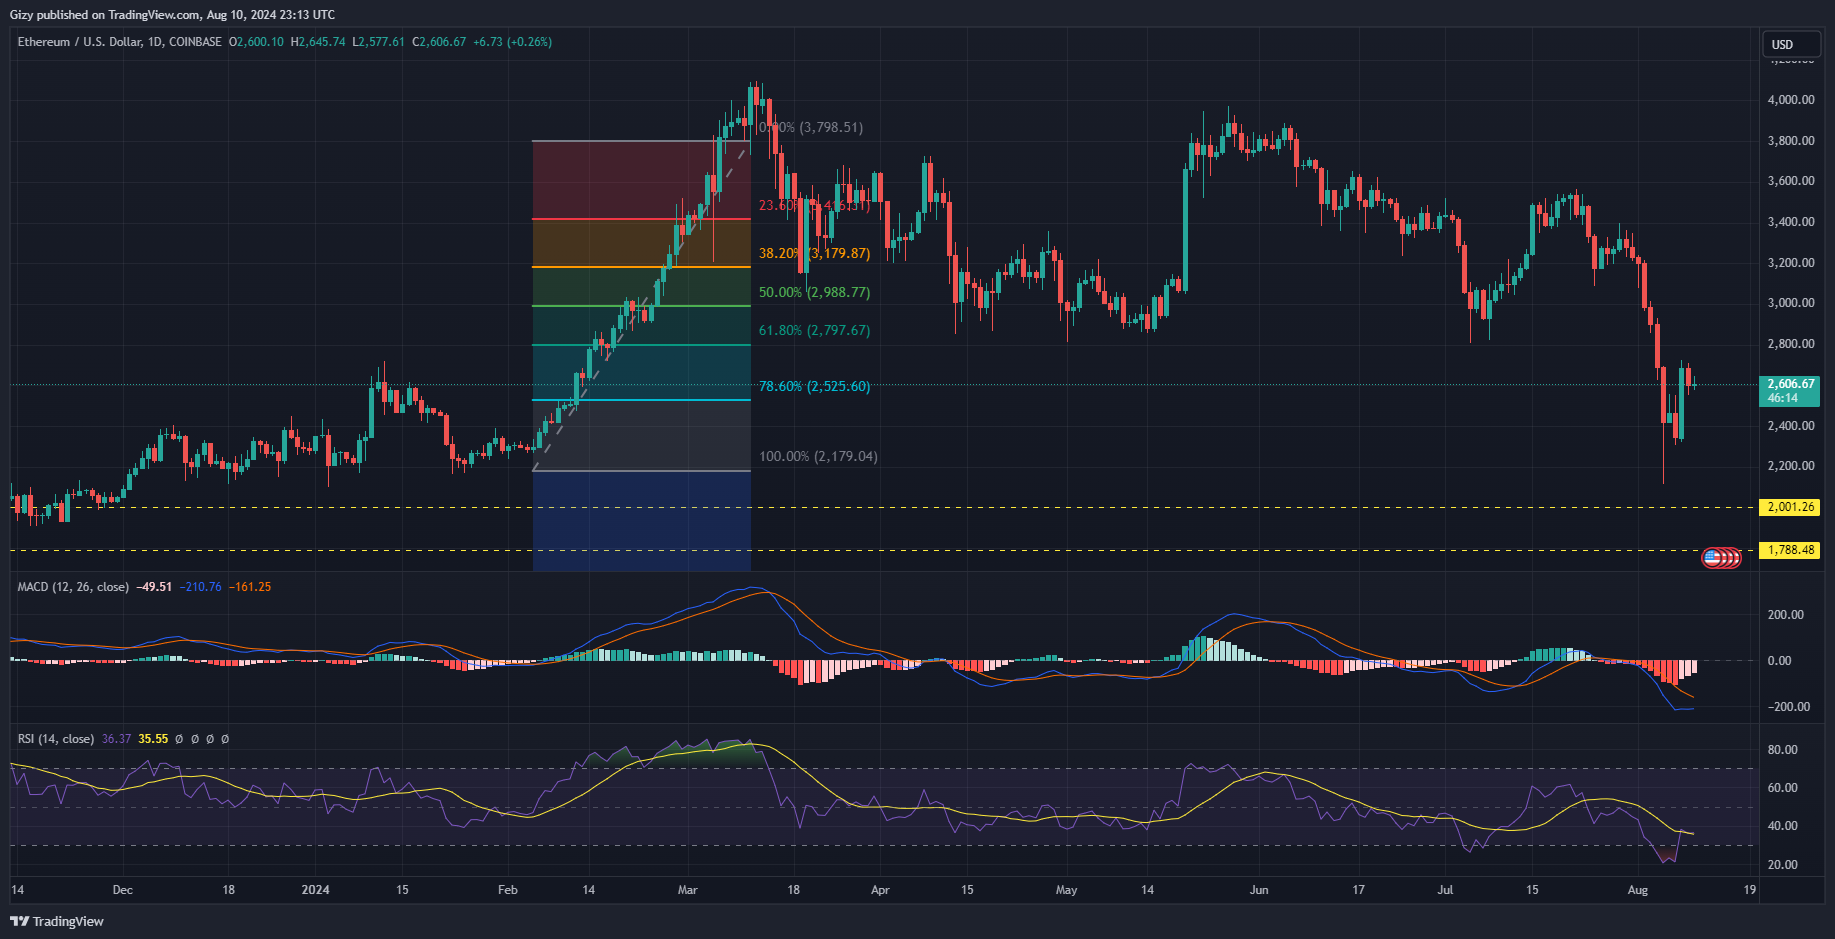
Attempts at recovery failed the next day after it surged to $2,420 but closed at almost the opening price. August 6 offered another go at reclaiming lost levels as the buyer staged a comeback. Trading started at $2,342 and peaked at $2,725. A minor correction saw it close slightly lower but register gains of over 14%.
The coin has since struggled to hold trading above $2,500. One of the most extensive tests happened during the previous intraday session when it dropped to a low of $2,533 and closed with losses of over 3%. Nonetheless, the previous 48-hour price interaction opens $2,500 as a level with notable demand concentration.
RSI stopped trending below 30 as the August 6 surge saw it peak at 38. The change in readings shows that ETH is no longer oversold and has enormous potential for more surges. The same positive trend is also present in MACD’s 12-day EMA. The metric has since trended parallel since halting its decline.
The coin has also reclaimed the second pivot support and is trading close to the first pivot support.
BNB/USD
Binance coin has seen notable changes in its placement on the global cryptocurrency market cap ranking. It is facing stiff competition for the third spot from Solana and has since dropped down the rank and reclaimed.
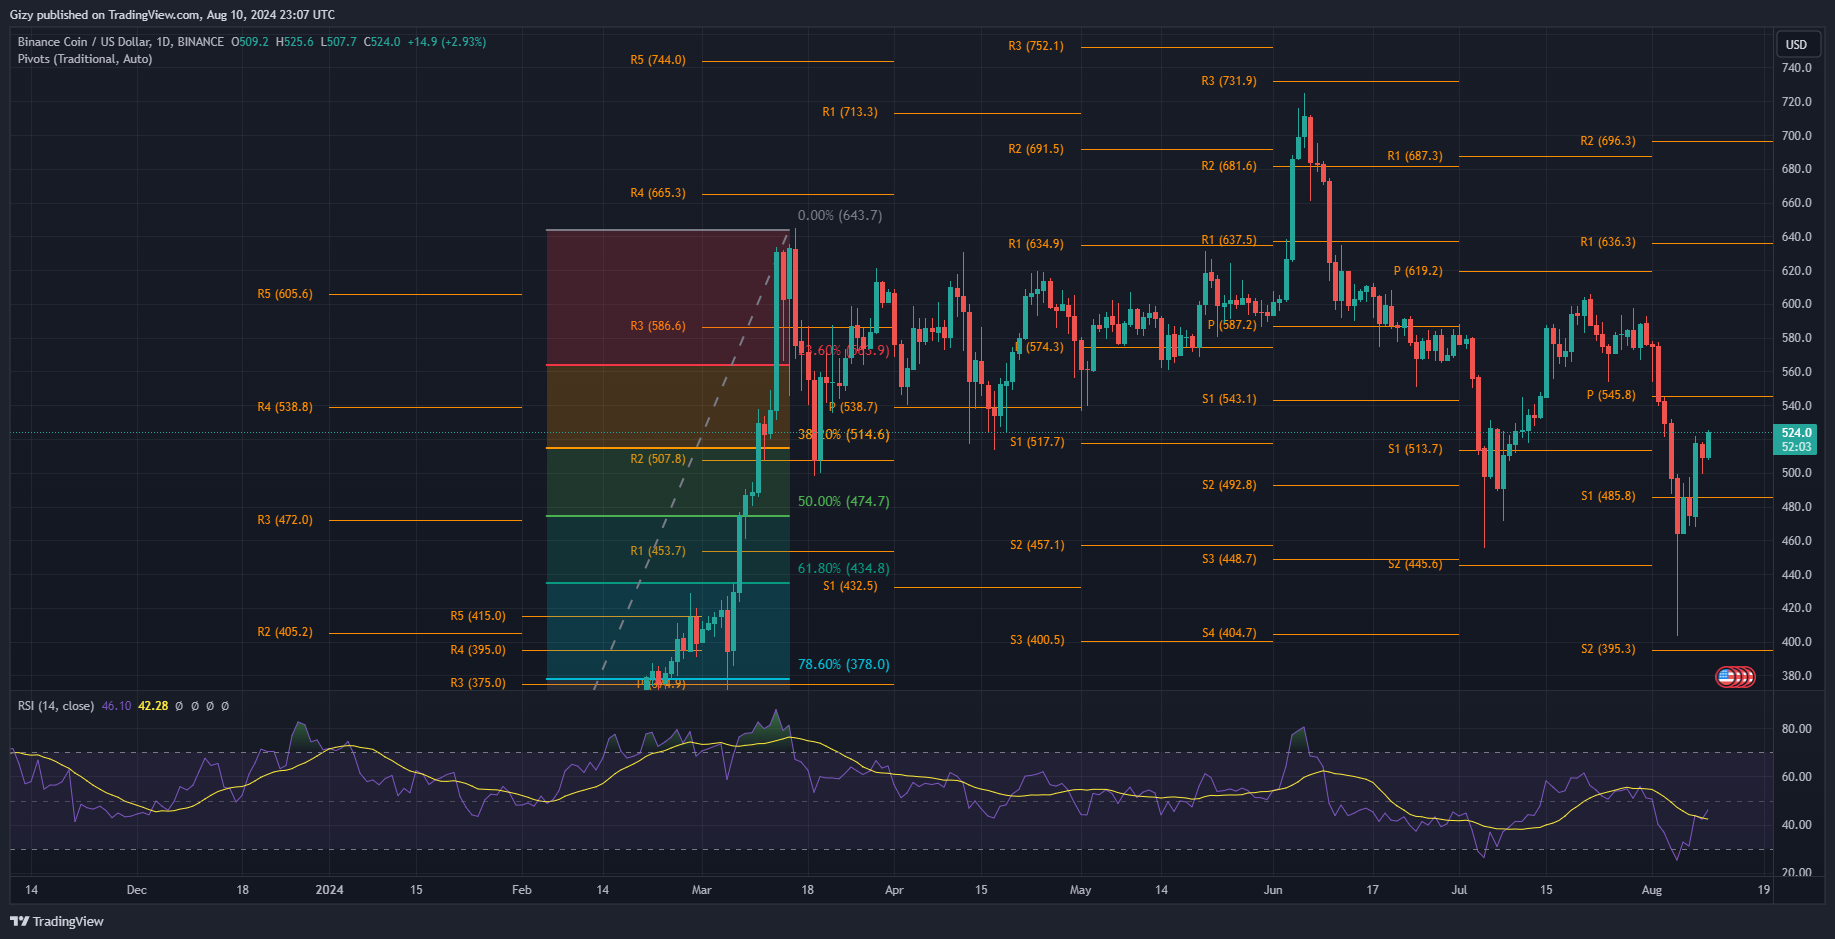
One reason for the constant change is Monday’s dip. The asset started trading at $497 but dropped as other cryptocurrencies. It retraced and tested $400 support but failed to flip it as it rebounded and closed at $464, which meant a more than 6% loss.
The recovery continued into the next intraday session as it attempted to reclaim all lost levels but failed after it failed to break the $500 as it retraced after peaking at $494. August 8 offered more in terms of price increases. It broke the $500 and peaked at $521 but experienced notable corrections and closed with gains of almost 9%.
BNB is seeing more price increases at the time of writing. It started the day at $509 and is exchanging at $525, indicating that the coin is up by almost 3%. Nonetheless, cryptocurrency is creating a notable gap in a critical support structure.
The Fibonacci retracement level indicates that Binance coin recently surged above the 38% fib level. It also points to $314 as a level with notable demand, and the bulls must defend it to avoid further price decline.
SOL/USD
Solana has been in a downtrend over the last 48 hours. It has since lost over 5% as the bulls appear to be exhausted. Nonetheless, it is up by over 37% from Monday’s low, when it faced massive declines after starting trading at $138. It soon retraced and lost the $120 support. It rebounded $110 and closed at $129 with losses of over 6%.
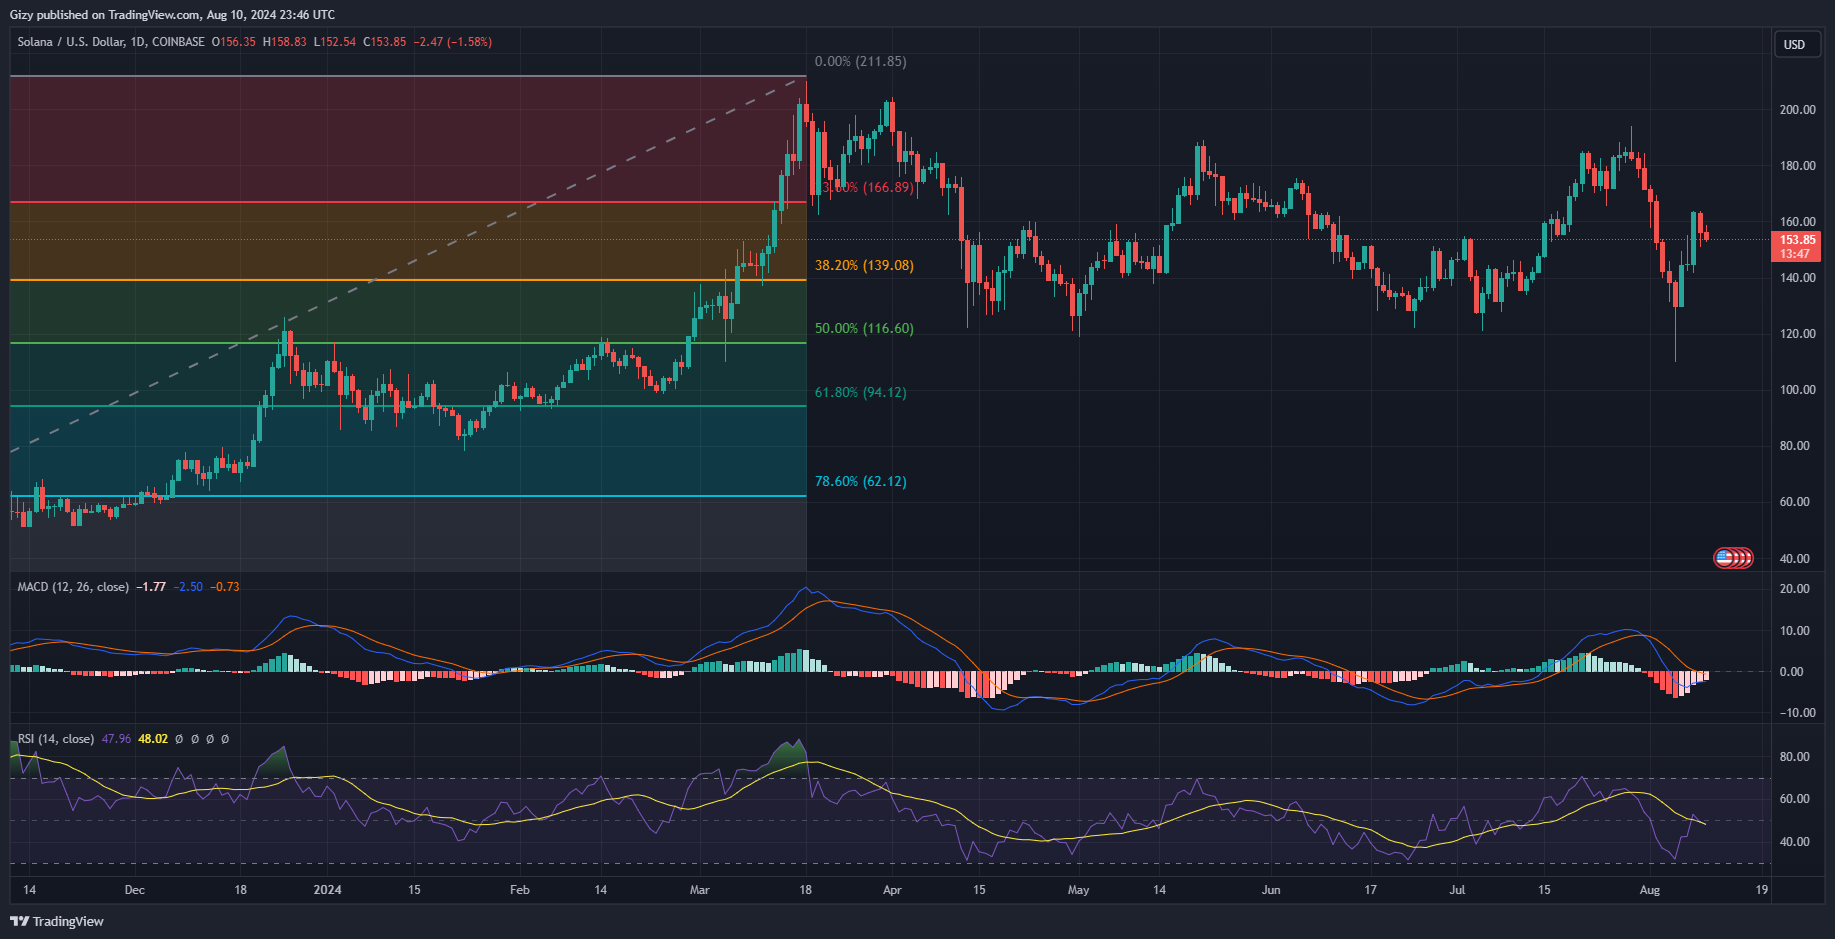
Recovery continued during the previous intraday session as it saw notable price surges. It edged to flip $150 but failed as it hit a brick wall at $149. It ended the session with gains of over 11%. August 8 saw the continuation of the uptrend after a surge to $155 the previous day.
The altcoin flipped $160 and closed with gains exceeding 12%. Nonetheless, trading held up above the $150 support amidst the notable declines in the last 48 hours. The bulls must continue defending $150 as the asset risks dropping below $140 if they fail.
SOL is trading above the 38% Fib level at $139. If it slips below $150, it may be the next level.
Indicators like MACD are still bullish amidst the notable declines. The 12-day EMA is still on the uptrend, and the 26-day EMA is seeing an opposing trend. With the asset undergoing a bullish convergence, the downtrend may alter this trend if it continues.
Find Cryptocurrencies to Watch and Read Crypto News on the Go Follow CryptosToWatch on X (Twitter) Now
