SOL has dropped to a recent low earlier but bounced back and is now trading at its opening price. It is currently struggling with minor selling pressure.
However, at the time of writing, the trading action indicates little volatility as the coin sees a decline in selling pressure. It also signifies a notable improvement in buying pressure compared to the previous intraday.
Nonetheless, the global crypto market cap is currently at $3.73 trillion. This comes after a past decline. The price movements suggest that sellers are becoming increasingly weary. Additionally, it is worth noting that the market is experiencing a significant 27% decline in volume, which is not entirely unexpected.
Additionally, investor sentiment in the industry has deteriorated sharply over the past 30 days to its lowest point. On Saturday, the fear and greed index dropped to a low of 39, down several points from its peak of 68. A closer view of the numbers indicates that the previous decline in sentiment to this level occurred in June.
Outside the number, the past five days have been marked by news of various institutions accumulating more cryptocurrency for their strategic reserves. Some of the popular ones were from Strategy, purchasing BTC after Monday’s dip.
It is interesting to note that a significant number of Bitcoin OGs have become active in the past five days, with some of them transferring their coins to Ethereum. Based on the general overview of the cryptocurrency market’s activity, let us examine how prices have trended.
BTC/USD
On Monday, BTC experienced a notable bounce back, resulting in losses of approximately 3%. It experienced a delayed but steady rebound over the next three days and was unable to recover the losses it had incurred earlier.
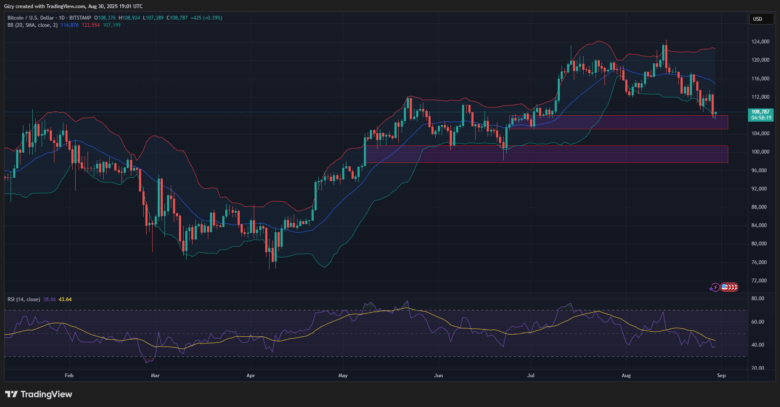
Nonetheless, on Friday, the leading asset had another huge retracement. But, this time, it hit new levels that it had not experienced since the first week of July. The coin dropped from $112,581 to $107,488 before rebounding and losing nearly 4%.
The coin prints a little candle as it is seeing mild volatility on Saturday. However, a few hours ago, it recorded another but rebounded.
A past analysis showed that the leading coin has double demand zones, with the first between $ 108,000 and $105,000. It noted that it will likely experience a significant retracement around this zone. The recent pullback shows the second time in August that a coin has sold within this zone.
However, it is crucial to note that, a few hours ago, Bitcoin retested Bollinger’s lower band. Over the last seven days, the indicator underwent various retests, with a few resulting in a pullback. Outside the bollinger bands, the MACD is trending downward as a result of the numerous selloffs, showing an enormous downward momentum.
ETH/USD
At the time of writing, Ethereum is printing a doji. Nevertheless, the newest candle shows a significant improvement from the past intraday session. ETH began that session at $4,511 but rebounded to a low of $4,268, plummeting below $4,300 for the first time in the past week.
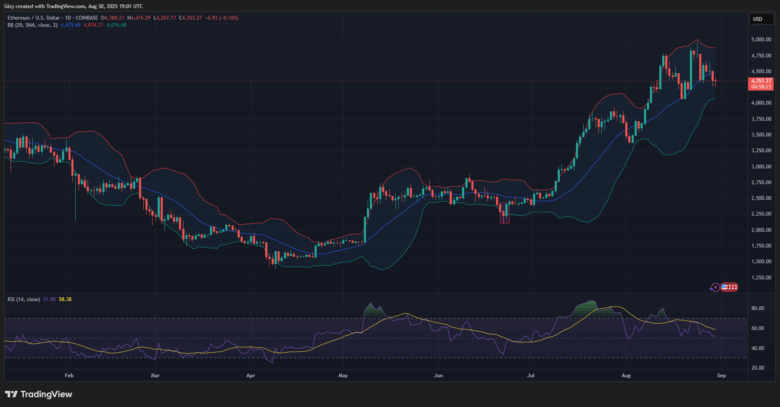
Furthermore, in the early hours of Saturday, the coin experienced a downturn but is now recovering, and investors are holding prices steady at its start. Additionally, the RSI suggests that the asset is experiencing nearly equal pressure from bears and bulls.
The bollinger bands show that since Ethereum tested the upper band the past week, it has witnessed a huge retracement. ETH is now selling near the middle band. Nonetheless, another trend is emerging, as the upper and lower bands are clashing due to reduced volatility.
Furthermore, Ethereum is trading above a major support level at $4,200. The obstacle stood out against various trials and is likely to continue holding.
XRP/USD
Ripple is trading at $2.80 and has spent a considerable amount of time without reaching this mark. However, its recent price shows a bounce back from a slight drop to a low of $2.76, which happens to be its lowest value since August 3.
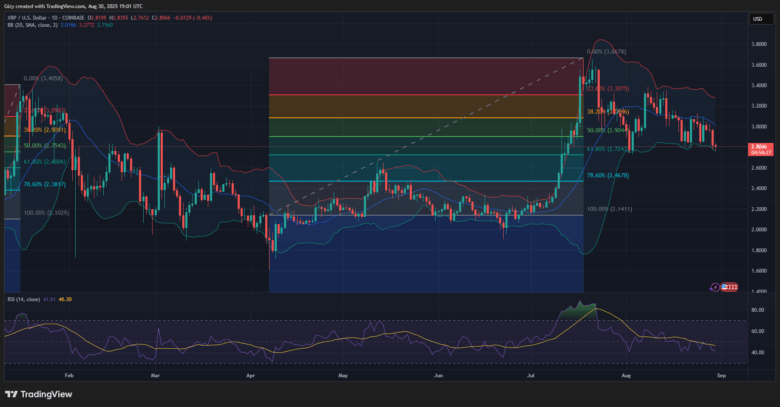
Nevertheless, on Friday, the coin had one of its highest declines. It declined from $2.96 to a low of $2.77 before a little pullback. The coin ended the session with losses of nearly 5%.
If Saturday closes on a red, it will simply mark the coin’s fourth consecutive day of downtrend. However, it is crucial to note that the coin is selling at a serious level. There is an exchange above the 61% fib level. A closer view of this mark shows that ripple has held this obstacle since the middle of July.
In addition, it is important to note that a few hours ago, they retested the bollinger bands. The indicator is trending downward as the upward movement is decreasing. Nonetheless, it is crucial to note that the asset has trended almost to the middle band and consistently tested the lower band for close to 14 days now.
BNB/USD
Just like SOL, Friday was a bearish day for BNB. The coin experienced a significant retracement, declining to a low of $850. Nevertheless, it bounced back and finished with no notable losses.
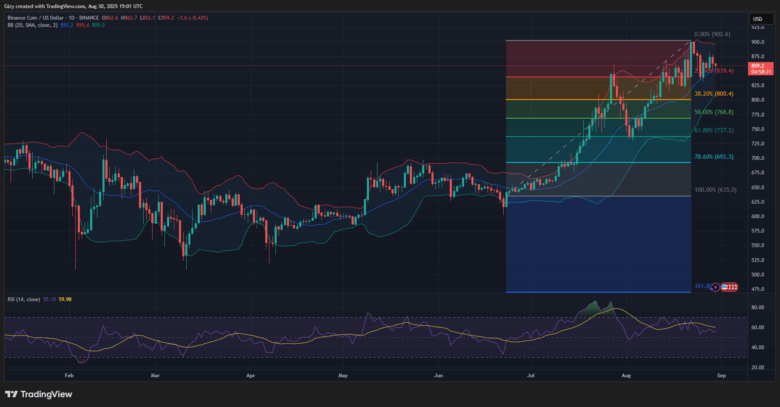
Looking closely at the candle that portrays the past shows that coin investors are becoming increasingly hungry for more increases. As a result, trading activity and selling pressure were significantly lower compared to Monday’s levels.
However, a few hours ago, the asset revisited its past. It is currently trading near its starting price. It is crucial to note that, in the past four days, the third trial was $850. This raises worries about how long it will hold.
Additionally, the 1-day chart indicates that the coin gained support within the Bollinger Bands. The asset has barely slipped below the middle band since recovering on August 8.
SOL/USD
SOL is experiencing another trading session on Saturday. A few hours ago, it plummeted to a low of $197, which was its lowest point in the past 72 hours. However, the selloffs began on Friday when the asset bounced back from a high of $217 to $199. Although it experienced little rebounding, it recorded losses of more than 4%.
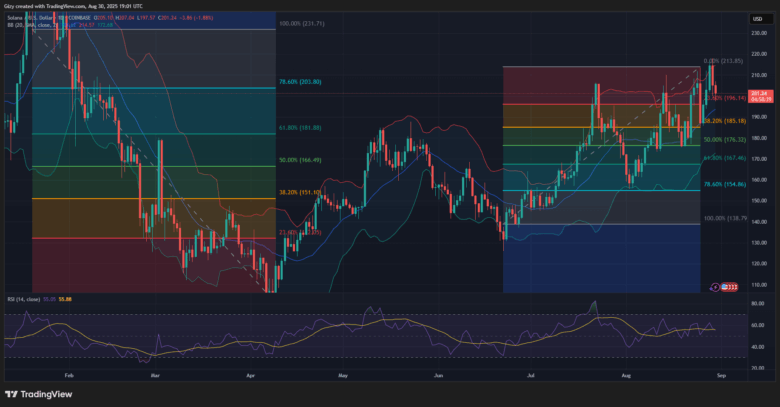
Nevertheless, at the time of writing, Solana is down by more than 2%. It gets nearer to clearing the losses it garnered on the sixth day of the week.
Furthermore, the Fibonacci pullback levels suggest that the coin is trading beyond a demand zone. It slipped nearer to retesting the 23% mark at $196 but bounced back after experiencing a buyback. Outside the fib levels, the RSI suggests that selling pressure is decreasing and experiencing delays.
Nonetheless, past price movements indicate that the coin must hold $200, as there are no levels with demand concentration below $182.
Find Cryptocurrencies to Watch and Read Crypto News on the Go Follow CryptosToWatch on X (Twitter) Now

