ETH is yet to reclaim the levels it lost on Monday despite several attempts. The 1-day reveals that while it sees notable increases, the bears are edging.
The gradual rise in selling pressure suggests that the bulls lack the necessary momentum to regain those lost levels. Nonetheless, the coin saw a 10% drop in trading volume over the last 24 hours.
The decline in traders’ interest is not limited only to ETH, as the global cryptocurrency market saw a more than 5% drop in volume over the last 24 hours. Nonetheless, the crypto market’s value peaked at $3.89 trillion a few hours ago.
However, the value is slightly lower as most assets are grappling with notable selling pressure. The fear and greed interest attributes the latest drop to reduced speculation of further increases. The metric is at 45, down two points from the previous day.
When the highlighted index drops, many turn their attention to the altseason index. At the time of writing, there has been no significant change to this metric as ETH and other altcoins are seeing a similar trend to Bitcoin.
A closer examination of the prices of several assets suggests an ongoing recovery is underway. Let’s see how it will affect the coins in the top 10
BTC/USD
Bitcoin prints a small candle on the 1-day scale, indicating better trading conditions on Thursday than on Wednesday. The coin ended the previous day with slight losses but erased them on Thursday.
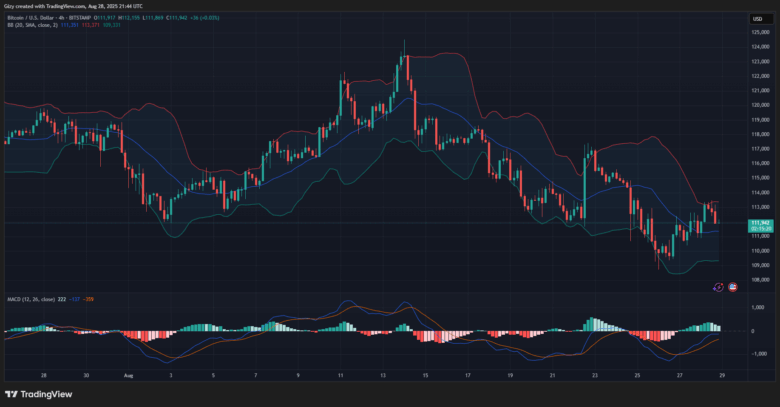
However, breaking the chart down reveals that the asset is printing its first green candle after 12 hours of consistent declines. The 4-hour chart also indicates that it rebounded off a critical support, the $112k barrier. It is in an uptrend, suggesting that the bulls defended the mark and are pushing prices higher.
Previous price movements suggest that if the uptrend continues, the coin will likely retest $114k in the coming days. Nonetheless, the bollinger bands point to notable selling pressure at the upper band. It is worth noting that the coin failed to break this mark a few hours ago, which led to the downtrend.
BTC will retrace below $112k if this trend repeats, and a drop to $110k is likely.
ETH/USD
Ethereum prints a doji on the 1-day scale, as it saw a notable increase earlier on Thursday but failed to continue upward, losing momentum. It dropped to a low of $4,438 a few hours ago but is currently trading slightly higher.
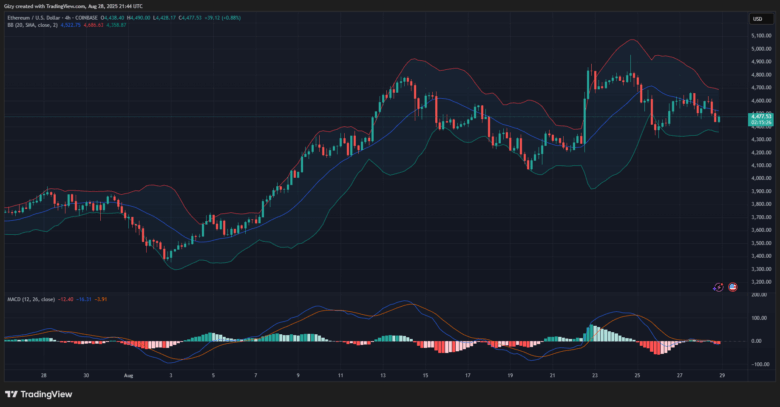
The 4-hour chart indicates that the altcoin is experiencing notable buying pressure as the relative strength index (RSI) is on the rise. ETH is also trading almost 2% from its low as trading conditions become positive. However, MACD remains unaffected by the latest improvements.
The metric print sell signal, as its histogram presents a longer bar. Its latest reading may indicate that the ongoing uptick may be short-lived. If this holds, ETH may resume its decline, dropping to bollinger’s middle band at $4,361. Supporting this assertion is the fact that the altcoin’s latest rebound started outside an established demand zone.
Nonetheless, continuing the uptrend will see the asset surge above $4,600 in the next 24 hours.
XRP/USD
XRP saw notable declines over the last 8 hours, retracing by almost 2%. However, it rebounded after dropping to a low of $2.94 and trades slightly higher at the time of writing.
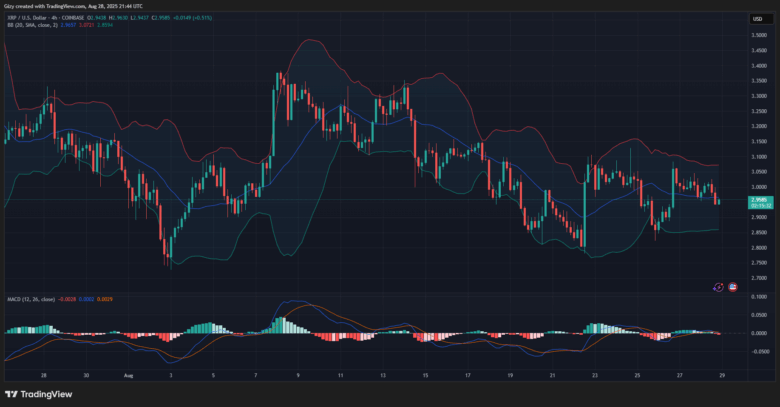
However, like ETH, the moving average convergence divergence remains unaffected by the latest price improvement. The metric displayed a bearish divergence on the 4-hour chart and continues to maintain the same pace. This may indicate bearish presence or a delayed reaction by the 12 EMA.
In the event of a bearish presence, the asset risks resuming its decline, potentially dropping below $2.90. The bollinger bands support this assertion, as previous price movements indicate that the coin almost always falls to the lower band after flipping the SMA.
BNB/USD
BNB peaked at $881 earlier but has since retraced after briefly surpassing the mark. However, the 4-hour chart shows that it did not register any significant decrease.
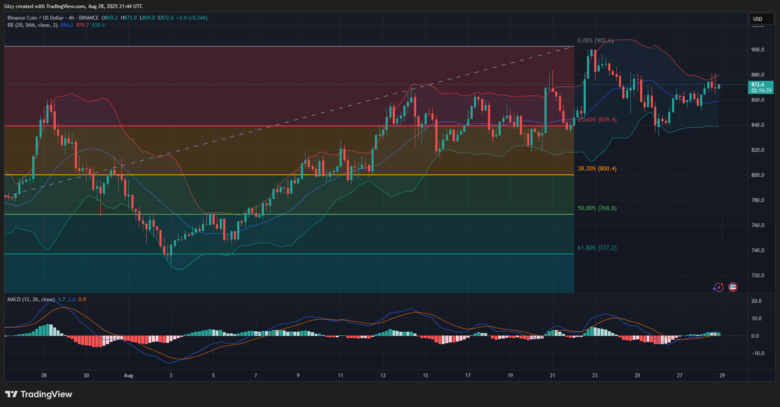
BNB trades at $876 as it rebounded after its previous drop below $870. Like ETH, it is seeing buying pressure at the time of writing. The coin is fast approaching its previous high but sparks concerns of an impending retracement.
It is worth noting that the asset has tested the mark twice on Thursday and saw slight retracements afterward. A repeat of this may happen $880 is a robust resistance. Aside from being a psychological barrier, bollinger’s upper band is also at this mark.
SOL/USD
The 4-hour chart reveals that Solana rebounded after dropping $207. The coin is currently experiencing notable increases at the time of writing. As a result, it trades more than 3% higher than its low.
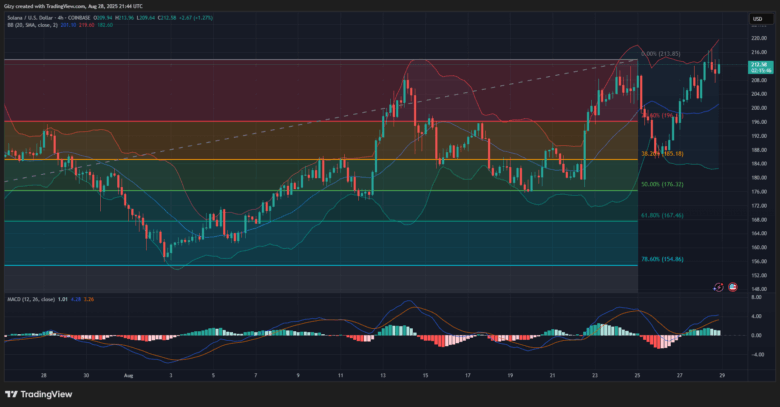
However, it is worth noting that the asset retraced after it briefly flipped the $216 resistance. It attempted the mark twice and had the same results; corrections. The coin is edging closer to breaking the mark again. It retested the level a few minutes ago and saw a slight decline.
Nonetheless, if the uptick continues, the altcoin may retest $220 (bollinger’s upper band). On the other hand, further retracement will send it as low as $200.
DOGE/USD
Dogecoin is trading close to $0.224, slightly below its high. However, a closer look at the 4-hour chart shows notable selling congestion around $0.225. It tried breaking above it thrice, flipping it just once.
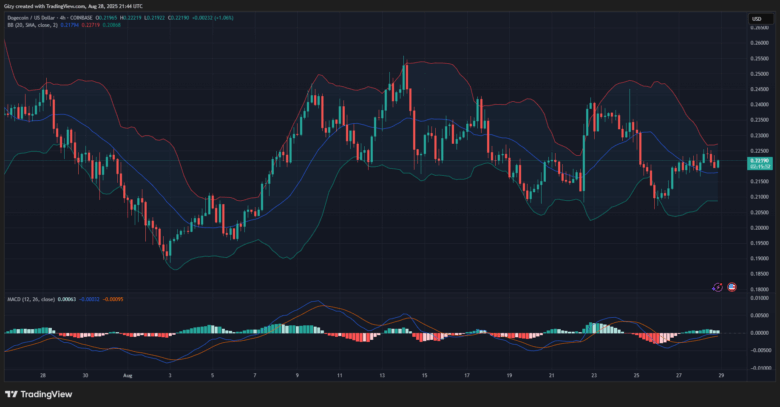
It is also worth noting that the previous decline started such an attempt. If the trend repeats, the memecoin may retrace below $0.22 again, edging closer to $0.215.
On the other hand, the moving average convergence divergence suggests that the asset will break out of this trend. The 2 EMA is rising, indicating notable buying pressure. The coin may retest bollinger’s upper band at $0.227.
ADA/USD
The 4-hour chart shows that ADA lost almost 2% during the previous session. It is on the verge of erasing this loss but sees slight rejections.
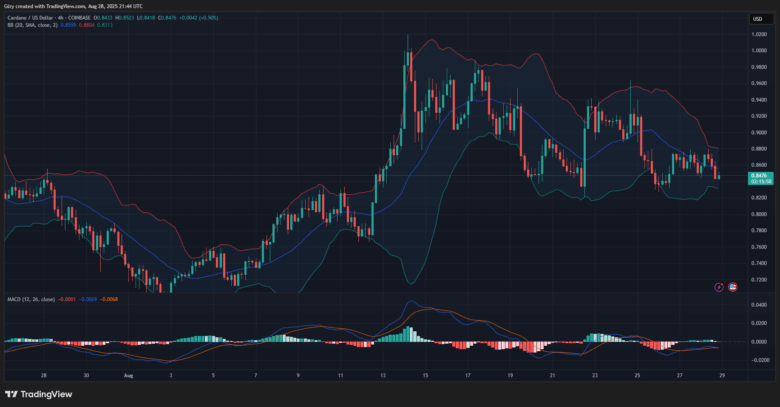
Nonetheless, MACD hints at further increases amid the ongoing selloffs. Its histogram prints a larger bar at the time of writing as the 12 EMA resumes its uptrend. The altcoin will surge, retesting its high at $0.88. Flipping this mark may guarantee an attempt at $0.90
However, the asset may lose momentum, dropping below $0.84.
Find Cryptocurrencies to Watch and Read Crypto News on the Go Follow CryptosToWatch on X (Twitter) Now

