BTC has lost almost half its gains from Friday. It lost momentum, and the bulls are yet to stage a buyback at the time of writing.
The asset is seeing a 20% decline in trading volume over the last 24 hours, explaining the failure to stage a price recovery. While the drop in buying and selling is unsurprising, as it’s the weekend, the apex coin is not the only asset seeing this trend.
The global cryptocurrency market cap dropped by almost 2% on Friday. It is seeing a 23% decrease in trading volume, as most cryptocurrencies see a gradual rise in selling pressure.
Nonetheless, Friday was the most volatile day of the week as the market registered significant increases. The sector under consideration surged by 6%, peaking at $4 trillion.
The surprise turnaround by the Federal Reserve to effect a rate cut in September was the trigger for the massive surge. Jerome Powell briefed the press that several factors, including the weakening labor market, may push the Fed to cut rates.
Trading actions on Saturday indicate that investors moved past the euphoria of the previous day. Most assets in the top 10 are down by a few percent. However, indicators are flipping bearish. Let’s see how they’ll affect prices.
BTC/USD
Bitcoin is trading at $115, 116 at the time of writing, following its recovery from a low. However, the asset remains in loss as the bulls are yet to show any significant attempt at buyback.
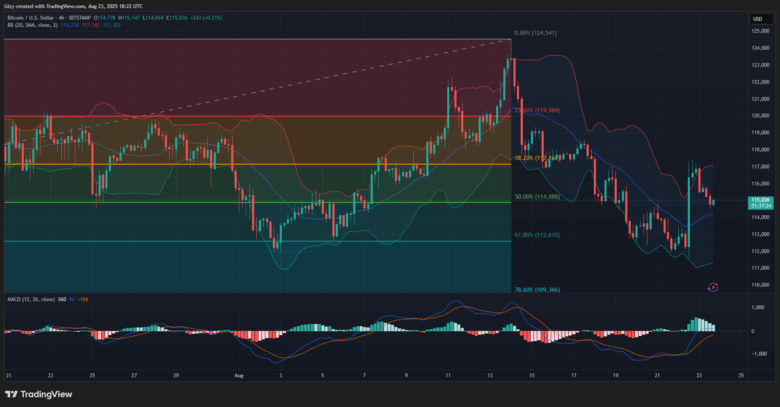
Trading on Saturday indicates that the bears are back in control after the massive gains the coin had on Friday. Indicators on the 1-day chart barely moved during the previous day’s hike, suggesting that the surge was short-lived.
Nonetheless, the 4-hour chart hinted that the uptrend was due for reversal. BTC surged above the bollinger bands, which traditionally signals the end of an upward movement. The ensuing decline is in response to this event.
BTC is trading below the upper band at the time of writing. It rebounded after it edged close to the middle band. However, previous price movements suggest that the latest pullback from decline may end. The apex coin will lose the $114k support, plummeting as low as $112k.
ETH/USD
Ethereum is printing a red candle on Saturday after massive gains on Friday. It printed one of its longest candles during the previous intraday session and gained a whopping 14%.
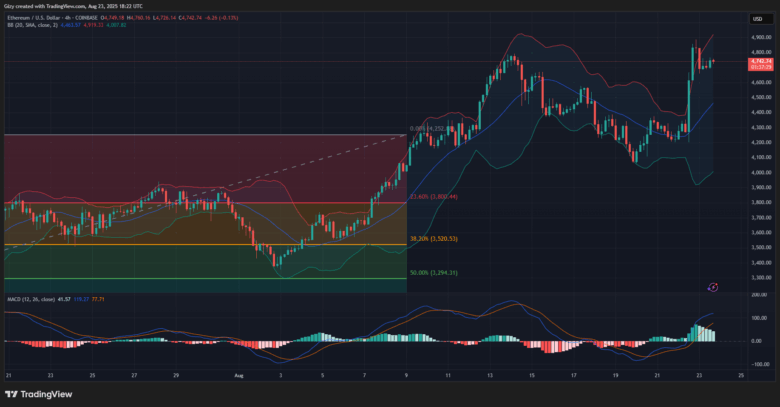
However, the coin is grappling with notable selling pressure at the time of writing as it failed to continue the previous day’s trend. The 4-hour chart shows that the coin had notable sell-offs at the start of the day and prices retraced as a result.
Nonetheless, it surged above its bollinger’s upper band on Friday. The price correction caused it to return to within the bands.
However, the chart shows that the altcoin trended sideways for most of the day, suggesting an impending breakout. The relative strength index suggests that it may retrace further. The metric indicated that the altcoin was overbought on Friday. Although it’s trending below 70, an upswing will send it above the mark.
XRP/USD
The 4-hour chart shows that XRP saw a significant decline in the early hours of Saturday. It has since attempted recovery with limited success. Nonetheless, the altcoin is edging closer to erasing its previous losses.
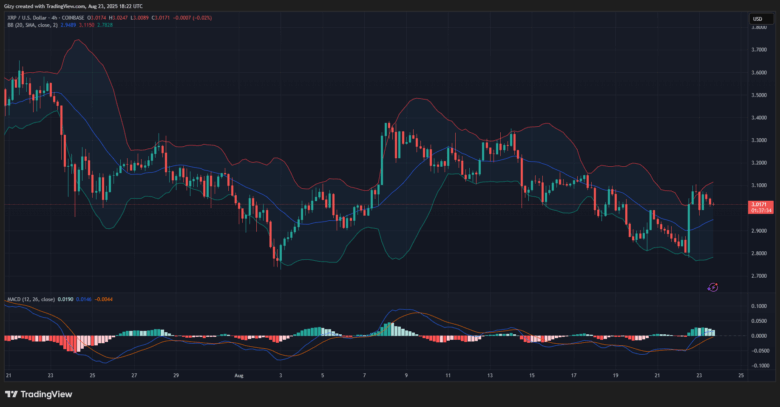
However, readings from the moving average convergence divergence suggest the likelihood of further declines. A closer look at the histogram associated with the metric reveals declining bars, indicating that there’s an ongoing bearish convergence.
A crossover will result in a drop below $3. The bollinger bands show the asset trading between the upper and lower bands. With a price drop in view, the altcoin may retrace to $2.95.
BNB/USD
BNB is seeing notable declines after it attained a new all-time high on Friday. The 1-day chart shows that it gained over 7% and peaked at $900.
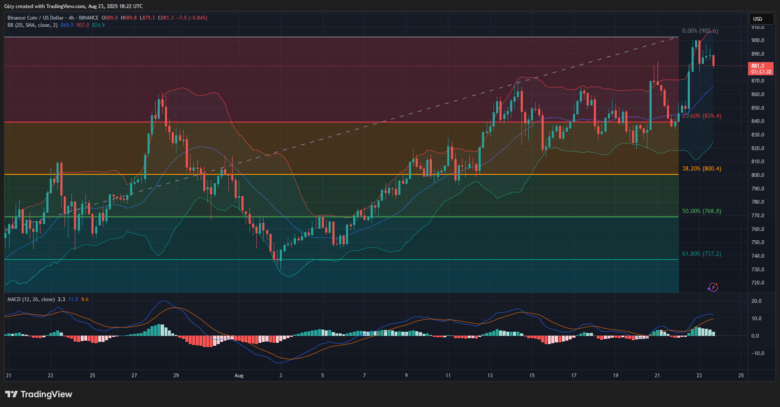
However, the 4-hour chart reveals that the altcoin is grappling with notable selling pressure. It dropped by almost 2% in the early hours of Saturday, and attempts at recovery yielded little to no result; moreover, the coin grapples with selling pressure at $880.
MACD displays a bearish convergence at the time of writing, indicating further declines. The bollinger bands suggest that the next price target will be $868, the middle band. However, previous price movement supports a drop to $860.
SOL/USD
The 4-hour chart reveals several attempts at continuing Friday’s surge. The bulls registered brief success as the altcoin surged in the session beginning at 4:00 UTC and peaked at $208.
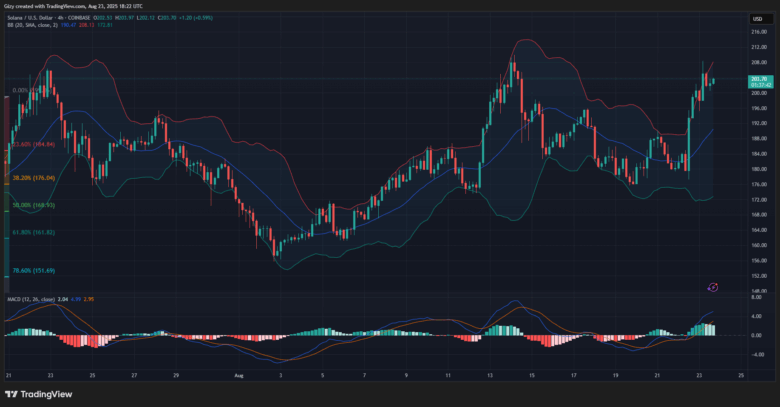
However, SOL has since struggled to surge higher as it retraced shortly after. Nonetheless, it trades at $203 at the time of writing, and indicators show room for further increases.
MACD shows both EMAs on the rise, and the bollinger bands reveal that SOL is trading below the upper band. The asset will retest $210 if the upward momentum continues. Conversely, a shift in sentiment can send the coin to $195.
DOGE/USD
DOGE mirrored the price movement of BTC earlier on Saturday. It registered notable losses during this period but recovered and is rangebound at the time of writing, trending between $0.24 and $0.235.
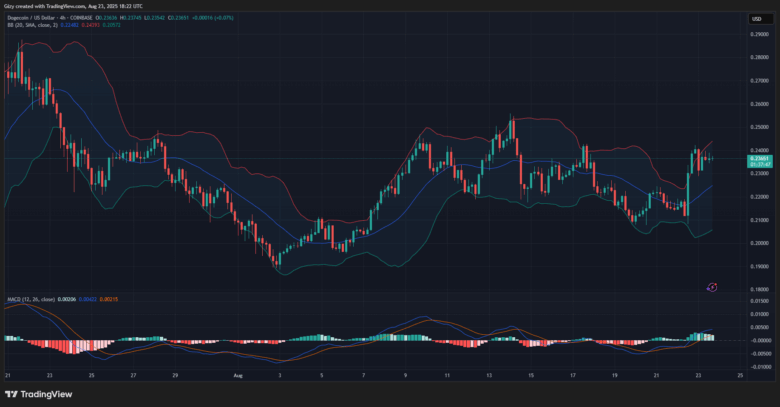
However, its current price suggests that there is an impending breakout, and indicators favor a downward slip. MACD’s histogram prints reducing bars, indicating that the gap between the 12 and 26 EMA is closing up.
The metric displays a bearish convergence, which may signal further declines. If this holds, DOGE will drop below $023. Additionally, the bollinger bands point to an impending drop to the middle band at $0.225.
ADA/USD
Like BTC, Cardano registered significant gains on Friday. It surged to a high of $0.92 and gained over 9%. However, it is grappling with notable selling pressure on Saturday and is down by over 2%.
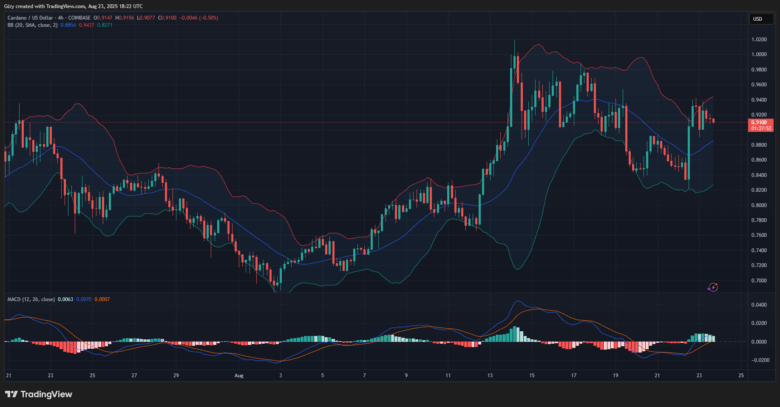
The 4-hour chart shows that the asset dropped to a low of $0.89 a few hours ago but rebounded. A closer look at the charts indicates that the $0.90 support has held out amid several attempts. However, MACD suggests that ADA won’t hold it for long.
The histogram prints reduced bars, indicating that the gap between the 12 and 26 EMA is closing up. The metric displays a bearish convergence, which may signal further declines. If this holds, ADA will drop to $0.88.
Find Cryptocurrencies to Watch and Read Crypto News on the Go Follow CryptosToWatch on X (Twitter) Now

