Ethereum is poised to see its first green day since the start of the year. The coin is set to finish the second quarter with significant gains.
Nonetheless, the coin has not been able to recover from its losses in the first quarter. It finished with losses exceeding 47%. It was among the disastrous hits in December, retracing from $3,700 to $3,000, and it continued into January. February experienced the highest downward movement of the quarter. The ETF moved from $3,300 to $2,073, finishing the month with over 30% loss.
The trading activities in March sealed the losses, as the ETF lost more than 18% following a retracement to $1,700.
Selling pressure slowed down in April when Ethereum retraced to $1,383. It started to recover strongly in May, with a significant 41% increase. However, June ended on a more neutral level as Ethereum printed a doji.
One of the quarter’s biggest hits occurred in April, as ETF recorded one of the most notable surges. After it began the session at $1,811, it surged to a high of $2,225, gaining more than 20% in just a single day. This happened after more than two weeks of a prolonged consolidation phase.
Notwithstanding, ETF has recorded a significant surge in its network activity and staked more coins for the past three months. According to reports from CryptoQuant, a substantial accumulation has occurred during this period.
ETFs recorded significant inflows. The United States ETFs recorded an influx of over $1.76 billion, as the Hong Kong spot ETF experienced significant investor participation.
Ethereum To See Uptick in Quarter 3
The 36% surge seen by Ethereum in Quarter 2 did not come as a surprise. This is because Q2 is typically considered the most profitable quarter of the year. Historical records indicate that Ethereum experiences an average quarterly growth rate of approximately 67%. It recorded its highest surge in 2017, spiking by more than 487%. Nonetheless, in 2022, it experienced a 67% decline in value.
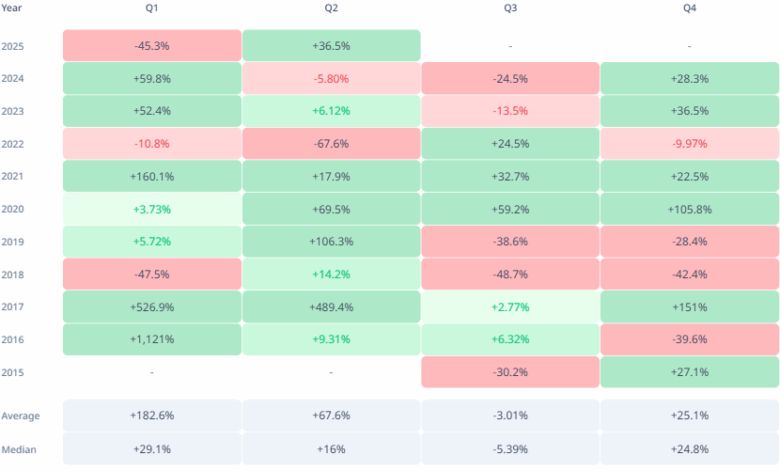
According to records, quarter 3 is usually not the best for Ethereum. During this period, it performed poorly, with an average loss exceeding 3%. It recorded its biggest surge in Quarter 3 in 2020, gaining 50%. Whereas in 2018, it registered its biggest loss, a 48% decline. Whether Ethereum will surpass its records in 2025 remains to be seen.
There are indicators that ETH will likely build momentum on the gains made in Q2. Having a close view of the chart above, you will see a clear pattern for gains and losses. Ethereum recorded significant losses twice in a row. Declining by 13% in 2023 and a 24% drop in Quarter 1, 2024. If this trend persists, the current quarter may lead to a notable upward movement over the next three months.
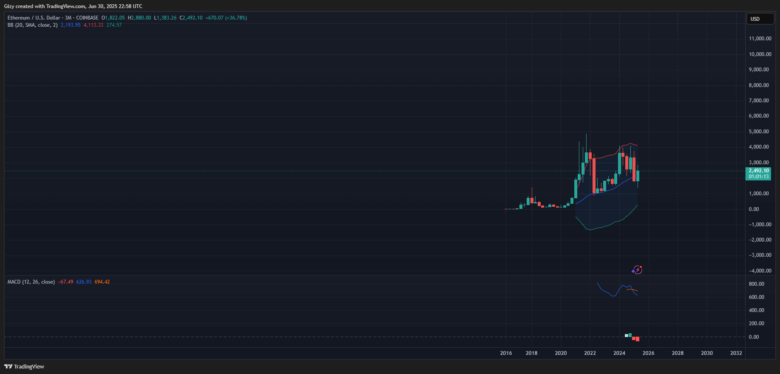
The 3-month chart supports this speculation. For the first time, ETH has slipped below the middle band of the Bollinger Band since its inception. And for the first time again, it dropped below the number during the last quarter. At the time of writing, it is selling above its current level, and further declines will likely see it return below this level.
At the time of writing, it has reclaimed that level, as the bulls appear to be holding onto it and seeing it as a future support zone for more gains.
If the talks of the altseason coming up soon eventually happen, the result will be massive surges. Moreover, a risk remains that there is a high chance of massive declines in Quarter 3. The growing dissatisfaction with Ethereum’s slow progress could lead investors to abandon it in favor of more profitable returns elsewhere.
A Bearish End For ETH
ETH, the largest altcoin, is expected to finish June with some losses, marking another red month for the asset. A review of its performance in 2025 so far shows that it has incurred significant losses in five out of the six months. And it’s no surprise that June also has no exceptions.
The chart above indicates that crypto experiences a less pronounced uptrend in June. Within this time frame, it records an average return of just 6.71%, which is the second lowest compared to the other months.
However, at the beginning of June, the apex altcoin faced significant selling pressure. The market sentiment started with Donald Trump’s threat of tariffs against the EU. ETH managed to shrug off the news as other positive basics made the rounds.
As the news of Israel bombing Iran broke, Ethereum began its downtrend. Iran’s revenge further fueled fear across the market. The panic of World War 3 heightened when the United States joined the conflict. Even after the conflict has ended, the ETF has yet to recover fully, leading to its bearish close.
On the one-week chart, for most of the month, Ethereum, the second largest crypto, was locked in rangebound movement. Its first major hit in the week started on Jun. 16, as it lost more than 12%. But it was good that in the following week, it recovered the lost value.
However, in the last thirty days, ETH has achieved numerous milestones. For example, its transaction fees increased by more than 130% in the week starting June 23. This was hugely driven by the growing interest from institutional participants in decentralized finance (DeFi) applications and a surge in smart contract usage.
Ethereum May Extend Its Decline
Ethereum could begin Q3 at risk of one of its highest declines. Judging from past records, the seventh month is usually the most bearish and volatile month for ETH. It recorded its highest increase in 2022, gaining more than 57%. It was met with its biggest loss in 2017, losing more than 30%. Nonetheless, it gains an average of 5.42%.
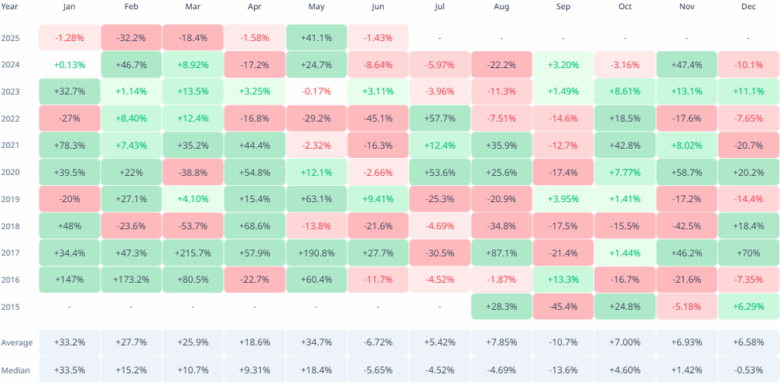
A closer view of the past returns shows a pattern. Ethereum experienced three years of consecutive gains but four losses. If this trend continues, ETH is on the verge of recording more significant losses in the next 30 days.
However, the 7-day chart shows that ETH may experience more increases before it retraces. It is currently trading above the middle band of Bollinger. It may also retest the upper band around $2,900.
There is a low chance of this happening, as it follows the massive surge the asset experienced over the past week. It is essential to note that MACD prints a buy signal, thereby increasing the likelihood of a spike to the highlighted level.
Despite this, the Moving Average Convergence Divergence (MACD) is currently printing a buy signal, indicating a potential short-term upward move. However, for now, cautious optimism prevails as Ethereum enters Q3 under pressure, with both technical indicators and sentiment offering a fragile outlook.
Find Cryptocurrencies to Watch and Read Crypto News on the Go Follow CryptosToWatch on X (Twitter) Now
