
Ethereum is ending the week with notable losses. The 1-day chart shows that the asset had a bad start to the session, printing a doji on Monday. A closer look at trading action over the last five reveals no notable upside movement.
The bearish dominance became more pronounced on Friday when the asset experienced one of its largest declines. It experienced massive rejection to its bid at $2,600, after peaking at $2,570. It retraced afterward, hitting a low of $2,367 and losing over 4% amid a slight recovery.
The altcoin is grappling with notable selling pressure at $2,380. It lost momentum after peaking at $2,450 and is now threatening to slip further. Nonetheless, its recent action sees it continue its trend of surging to a high and closing with slight losses.
Ethereum is seeing massive selling pressure at the time of writing. Several factors contributed to the latest outcome. One such is notable selling from institutions. Blackrock sold 19 ETH on Friday. It is also worth noting that the asset is experiencing a $321 million increase in sell orders.
The last statement aligns with the significant selling by dormant whales. Lookonchain noted that a wallet dumped 5000 ETH a few hours ago after holding since the ICO period. Further search through the platform reveals that this is not a standalone event, as another whale had previously sold 800 ETH.
The massive selling indicates massive profit-taking and the bulls’ inability to soak up the excess supply it creates. Institutional selloff may be the biggest telling sign as Blackrock is dumping a fraction of its holding for the first this June.
Price action over the last five days shows that traders are becoming increasingly cautious.
Ethereum Gears Up for Major Rebound
Some investors are changing their approach to investing in Ethereum. They are trading less and staking more. Data from DeFiLlama indicates that the asset saw a spike in the total value locked over the last three. The increase in this metric may suggest an appetite for short-term gains as they anticipate the next price actions.
However, a popular account on X shares a reason why ETH may surge in the coming days. It noted that the ETH/BTC pair is signaling a major reversal. It touched a key parabolic inverse trend, similar to what was observed at the previous cycle’s bottom. Traditionally, this may mean further upside for the largest altcoin.
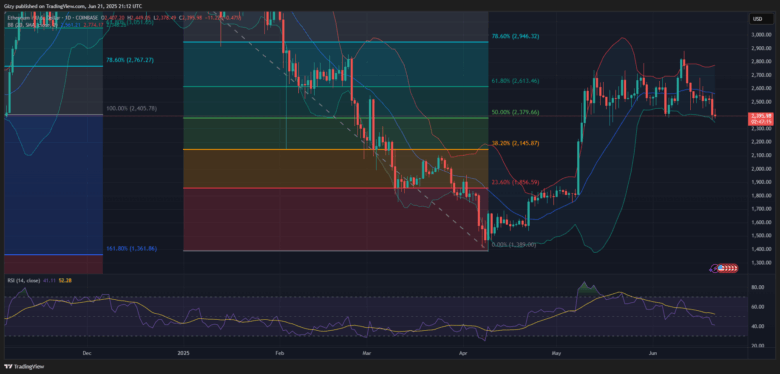
The 1-day chart suggests that the surge may not be in sight as indicators remain largely silent about the next price actions. The moving average convergence divergence and average directional index remain negative. RSI is seeing a further downward trend as selling pressure increases.
The Bollinger bands show Ethereum approaching the lower band at $2,340. A slip below this level is likely as the altcoin broke its seven-day low on Friday. Failure to defend this mark may result in a dip to $2,200. Readings from these indicators coincide with the over 36% decline in trading volume.
While indicators point to further downside movement, data from Santiment suggests that the altcoin is shaping up for a notable upward push. It noted the increase in the amount of new weekly $ETH addresses created, which ranges around 800K-1M per week.
