SOL is experiencing notable selling pressure around $148. It recovered from a decline that saw it retest its seven-day low.
The coin sees a more than 16% decline in trading volume as traders become increasingly bearish. SOL reflects the same trend as the rest of the market. Although the global cryptocurrency market cap is slightly down, it is experiencing a decrease in liquidity inflow. The 24-hour volume has since declined by almost 20%.
The fear and greed index sheds further light on the reasons behind the current state of the market. Investors are increasingly risk-off, expecting more downside movements. The metric is at 48 and tilts toward slipping further if fundamentals do not improve.
Data from Santiment indicates that traders are growing increasingly impatient with the current trend and shifting toward profit-taking. The number of bullish comments has significantly reduced over the last few days, reflecting the growing sentiment across the market.
Nonetheless, some altcoins are on the uptrend amid the downtrend. SEI is experiencing massive growth at the time of writing. It surged to a high of $0.19 but trades slightly below the mark, remaining over 3% higher than its opening price.
Most assets in the top 10 are grappling with notable selling pressure. Investors remain largely uncertain about their direction. Let’s examine some key levels.
BTC/USD
A look at the 1-day chart reveals that the apex coin saw lesser volatility over the last two days. It hovered between $103k and $105k on Wednesday. It is repeating the trend on Thursday but is yet to register any significant price change.
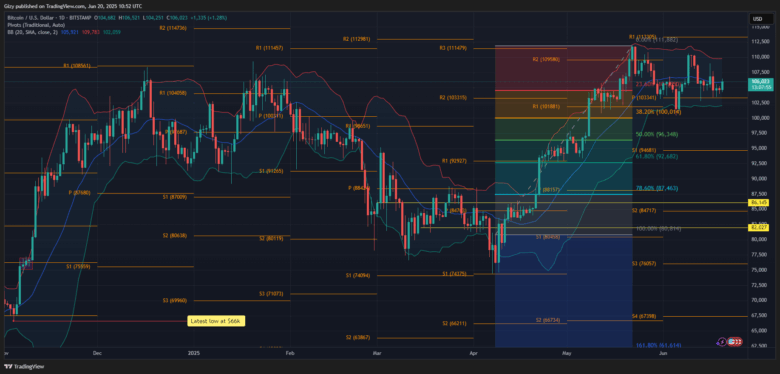
Nonetheless, Bitcoin risks further decline as it approaches the pivot point at $103,341. It tested the mark twice in the last three days. The consistent attempt at the mark may cause the support to buckle as the bulls become exhausted. A slip below this critical level will see the largest altcoin retrace to $100k.
Conversely, a change in price trajectory will see the coin surge. BTC will likely retest the $108k mark and hover around this level before experiencing further upside movement. The bollinger band shows the asset trading below the middle band. It supports speculations of a possible upside movement to the highlighted price level.
ETH/USD
Ethereum is experiencing a similar trend to SOL. It is seeing notable selling pressure at the time of writing. It reclaimed the $2,500 mark a few minutes ago and threatens further decline.
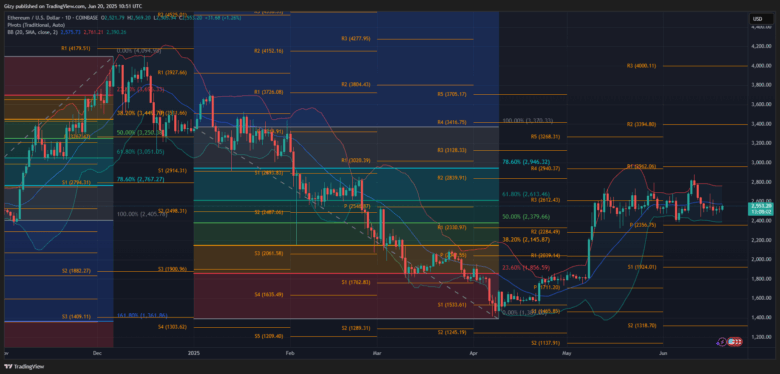
However, this is not the first time the altcoin has slipped below this level. It dropped below the mark on Wednesday and Tuesday, edging closer to breaking its seven-day low at $2,450. Previous price movements suggest that ETH may reclaim the lost level as it hovered close to it over the last three days.
Nonetheless, it risks further descent. While a rebound at $2,450 is likely, the growing bearish sentiment across the market may see the asset dip below it. Ether may retest $2,400 before rebounding.
However, the fibonacci retracement level favors a slip to the 50% fib mark at $2,379, pointing to the notable selling pressure around it. The highlighted price mark is also close to the pivot point.
XRP/USD
XRP slipped below $2.20 last week and has since failed to flip it decisively. It dropped from $2.25 on Tuesday to $2.14, representing a loss of over 3%. It dipped lower on Wednesday, hitting a low of $2.11 before rebounding.
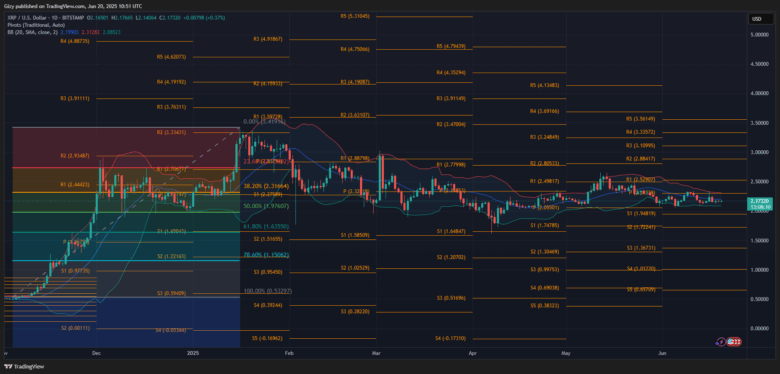
XRP may retrace below $2.10 as it experiences notable selling pressure. It saw a similar movement on Friday, dipping to a low of $2.08. The asset may attempt a breakout from the bollinger band, retesting the lower SMA.
Nonetheless, it trades close to the middle band, which may mean possible recovery. It will reclaim the $2.20 resistance and edge closer to $2.30.
BNB/USD
Binance coin sees notable increases on Friday and trades at $647. The asset is on the verge of ending negative after days of slight losses. However, the coin shows no signs of sustaining the momentum as it is trading slightly lower than its high.
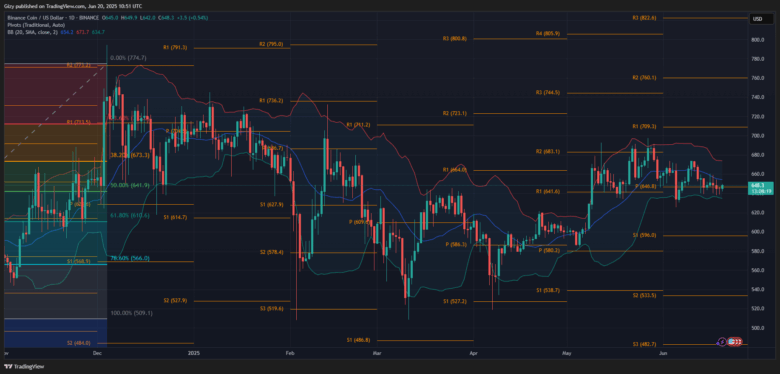
A closer look at the 1-day chart reveals that the asset has maintained its position above the $635 support. It may sink to retest this mark, but a rebound is almost inevitable. BNB will continue, ranging between $655 and the highlight barrier.
The pivot point supports this speculation as the altcoin hovered close to the metric over the last seven days. There are no signs that it is about to halt the trend.
SOL/USD
SOL prints the second green of the week as it recovers from a dip to $144. It continues higher than the previous day’s high. However, it is yet to overturn its bearish start as it heads for another close with notable losses
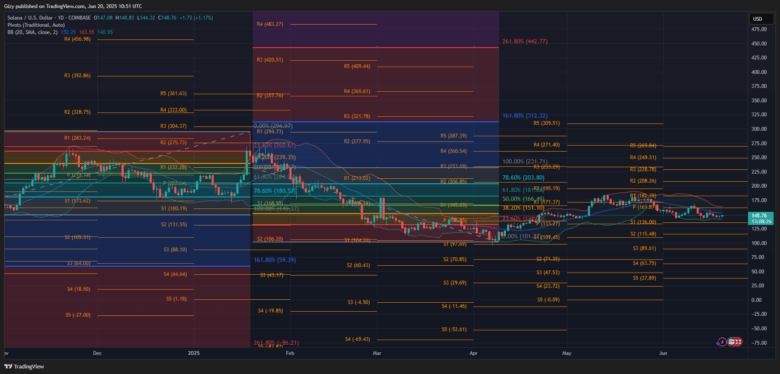
Solana trades at $148 and hints at reclaiming $150 if the bulls maintain the same trend. The bollinger bands suggest that it may continue upward after flipping this level. SOL may edge closer to retesting the middle band at $152.
However, it risks a trend reversal that may see it retest the $140 support.
DOGE/USD
Dogecoin has been locked in the same trend over the last 48 hours. It maintained the same low level but saw slight increases, similar to SOL. The 1-day chart shows the memecoin printing the same candle during this period, which may indicate an impending breakout.
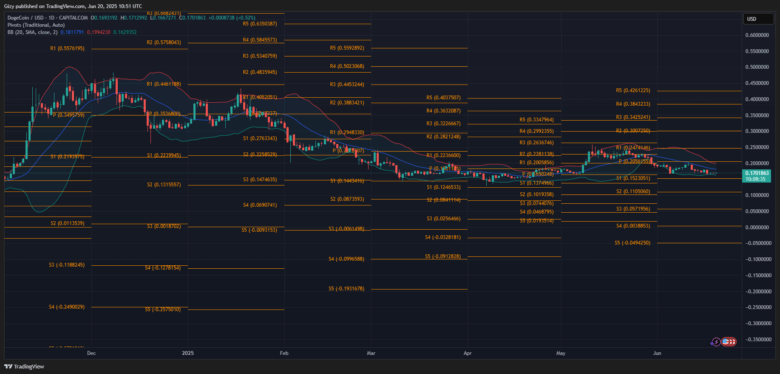
However, indicators on the chart remain silent as to when. Nonetheless, DOGE will look to break above its three-day high at $0.171. Flipping this mark will cause it to attempt $0.18 resistance.
Conversely, the asset retested bollinger’s lower band on Tuesday and Wednesday. A rejection at its two-day high may trigger a slip to this mark.
TRX/USD
TRX continues its streak of seeing less volatility. It had an explosive start to the week but struggles to continue the trend. It grapples with slight selling pressure at $0.274 and hints at further price decline.
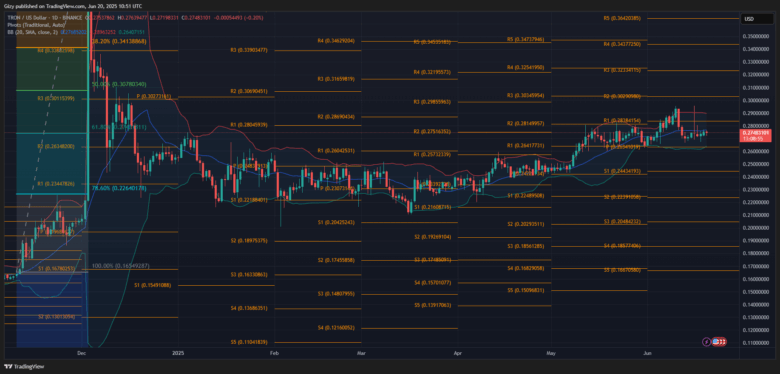
The bulls will look to resume the uptrend, potentially causing a retest of the $0.280 resistance level. Tron may edge closer to the first pivot resistance after reclaiming this level. However, it risks further decline to its seven-day low at $0.268.
It is worth noting that it maintained trading close to bollinger’s SMA. The trend may extend.
Find Cryptocurrencies to Watch and Read Crypto News on the Go Follow CryptosToWatch on X (Twitter) Now
