Solana trades at $153 at the time of writing. It is experiencing one of its biggest corrections, as it has slipped from $161 to a low of $152.
Its current price indicates that the asset is experiencing a slight improvement following its decline. However, fears of a slip below $150 remain palpable.
The coin continues the downtrend after retracing from $165 to $159 on Wednesday. Trading actions during the previous intraday session marked its first red candle after five days of consistent increases.
However, a look at the previous price action on Tuesday explains the reason for the ongoing decline. The bulls showed signs of exhaustion as the altcoin retraced from $161 to $156. Although it rebounded and broke above its seven-day high, it indicates a spike in bearish action.
The coin printed a hammer during this period, signaling the end of the uptrend. Further factors worsen the downtrend. One such is the downtrend affecting Bitcoin. SOL has a positive correlation with the apex coin.
BTC experienced significant selling pressure due to negative fundamentals, resulting in a sharp decline in prices. Solana is reflecting the same trend, dropping to its lowest value in the last three days. Nonetheless, a delay in the approval of the SOL ETF may also contribute to the ongoing downtrend.
The revival of interest in Aura played a significant role in the massive gains Solana saw during the first two days of the week. The token made the rounds with its tremendous surges, gaining over 2,000% on Tuesday and 173% on Wednesday, which were among the key highlights. However, the asset is losing its appeal at the time of writing.
The Wolf of Crypto Street said the latest surge may be short-lived. He added that “cabals reviving old coins is way better than creating replicas of existing ones.” Reactions to this statement showed others agreed.
Solana May Retest $140
A trader on X shared a chart that indicates that the altcoin will dip below $150. The image highlighted several levels to watch out for and hinted that a slip to $146 is likely.
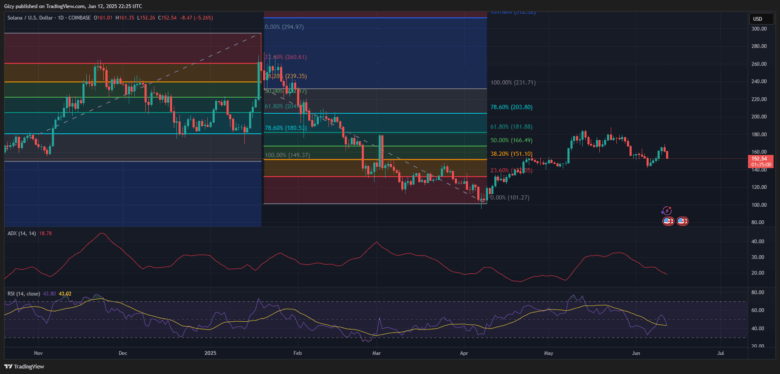
Indicators on the one-day chart support this claim, as most are negative at the time of writing. The moving average convergence divergence prints sell signals as the 12 EMA crossed the 26 EMA. Its divergence may indicate a further decline in the coming days.
The average directional index indicates that the asset is seeing a new level of selling pressure. It may further decline as it sees more selloffs. The relative strength index prints a similar signal, dipping the bearish dominance becomes prominent.
Previous price movement shows that Solana may slip as low as $140. Nonetheless, it may rebound around $144.
Find Cryptocurrencies to Watch and Read Crypto News on the Go Follow CryptosToWatch on X (Twitter) Now
