XRP is on the verge of losing all its accumulated gains. It threatens to return to the previous day’s low, as the bulls have yet to cause a buyback.
The coin will print its first red candle after four days of consistent increases. XRP sees a spike in selling pressure amid its over 26% increase in trading volume.
It reflects the same trend as the entire crypto market. The sector has seen a massive 49% surge in buying and selling over the last 24 hours. The hike reflects growing optimism across the industry. Investors are becoming increasingly bullish as the fear and greed index has seen a notable shift to the positive—the metric shot up from 55 on Monday to 64 at the time of writing.
Several altcoins are reflecting this bullish sentiment. Uniswap is poised to reach a new 2025 high. It is experiencing one of its biggest surges, shooting up from $6.84 to a high of $8.31. The candle suggests that the bulls may cause a further uptick as they sustain the ongoing momentum, keeping the price close to its peak. It remains to be seen whether it will break above its four-month high at $8.40.
Some of the top 10 cryptocurrencies are displaying notable bearish trends. Will they see a reversal? Let’s examine some levels.
BTC/USD
The 2-hour chart shows that the apex coin is printing its third consecutive red candle. Its latest trend followed a bearish divergence on MACD. RSI reveals that the asset was overbought on Monday, and the latest decline is in response.
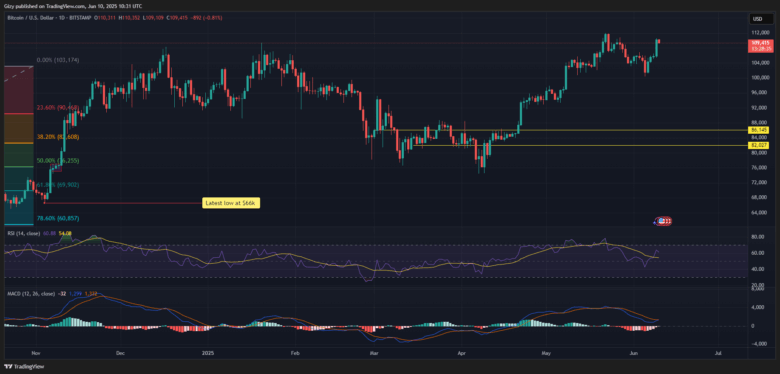
Based on readings on the timeframe, BTC may be gearing up for further decline. The relative strength index on the one-day chart supports this claim as it shows growing selling pressure. Bitcoin risks retracing to as low as $106k in the coming hours if the trading conditions remain the same.
However, the moving average convergence divergence favors further upside movement. It displays a bullish divergence that may signal more buying action. Based on this metric, the largest coin may rebound, potentially reclaiming $110,000.
Previous price movements indicate a possible attempt at $112k. On-chain metrics support this prediction: the derivative market remains positive, and the funding rate has soared.
ETH/USD
Onchain data shows Ethereum is piquing the interest of many investors. The derivatives market is teeming with life as open interest soared by over 15% in the last 24 hours. It will aim to continue the previous day’s hike, which saw it surge from $2,479 to $2,695.

ETH broke above its seven-day high at $2,789, registering a new high at $2,798. Its latest surge is unsurprising, as a previous analysis pointed to a flip of $2,700. It predicts a rise above $2,800 and noted several metrics as proof.
The indicators print the same signals. For example, MACD shows the closing gap between the 12 EMA and 26 EMA. A complete convergence will be followed by a divergence afterward. The relative strength index reveals notable buying pressure, surging from 61 to 64.
However, the 2-hour chart indicates that the largest altcoin may experience a shift in its price trajectory. The asset is overbought and due for correction. It will retrace to $2,655 if the bears stage further selling congestion.
XRP/USD
XRP is down by 2% over the last 18 hours. It grapples with notable selling pressure at the time of writing but may recover. It retraced to a low of $2.26 a few hours ago but rebounded and is now trading slightly higher.
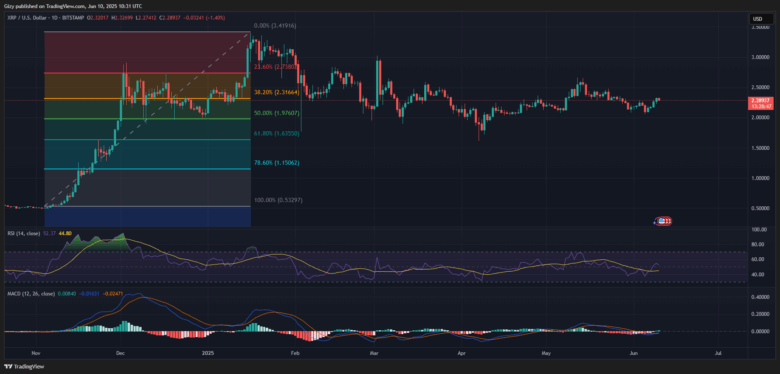
The 2-hour chart indicates that the asset is shaping up for recovery. It shows that the asset is currently printing a doji as the bulls struggle to stage a buyback. RSI halted its downtrend as buying pressure increased.
Its readings coincide with those on the one-day chart. The moving average convergence divergence prints buy signals at the time of writing. It suggests that XRP may approach its opening price.
BNB/USD
Binance coin slipped to a low of $657 and rebounded. It trades at its opening price at the time of writing, marking a full recovery. Indicators suggest that the altcoin is gearing up for more increases.

The relative strength index indicates that the asset is experiencing nearly equal buying and selling pressure. The moving average convergence divergence shows the 12 EMA edging closer to crossing the 26 EMA. It signals further buy signals that may lead to more uptick.
Previous price movement reveals an impending attempt at the seven-day high. BNB will retest the $675 resistance.
SOL/USD
Solana declined further a few hours ago. It retraced from $161 to $156. However, like XRP, it rebounded and trades a little higher than its low.
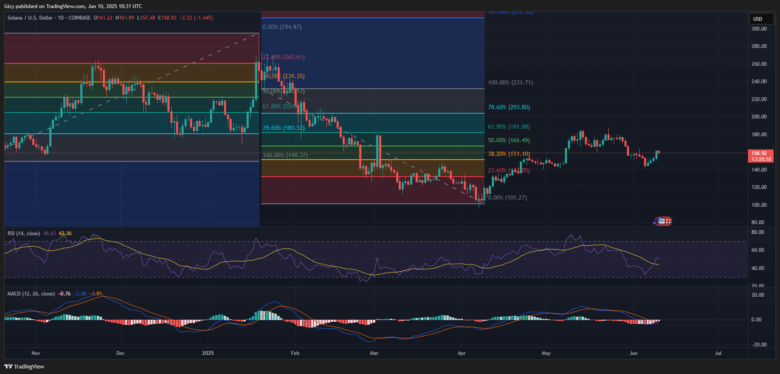
The 2-hour chart shows the asset is shaping up for further price declines. MACD had a bearish divergence a few hours ago. It will likely see further declines in the coming hours, with previous price movement indicating a potential drop to $153.
Nonetheless, the one-day chart reveals a possible rebound. MACD shows the 12 EMA on the rise, edging closer to the 26 EMA. The smaller bar on the histogram suggests that the coin maintains its upward trajectory amid the ongoing decline.
DOGE/USD
Dogecoin is grappling with notable selling pressure at the time of writing. It surged from $0.186 and peaked at $0.197. It saw a notable rejection of its bid at $0.20 and retraced, trading at $0.190.
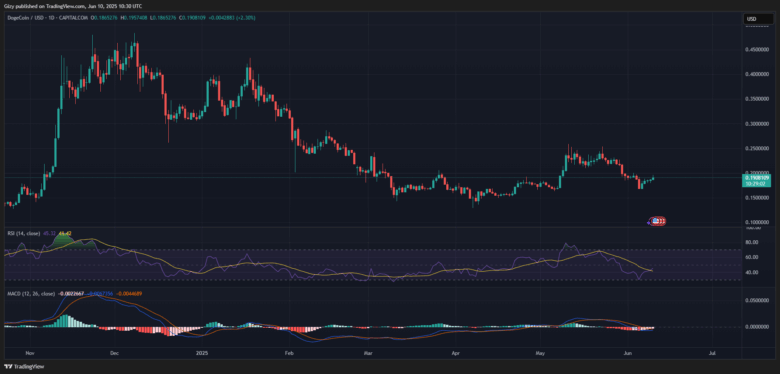
Nonetheless, DOGE is on the verge of marking its fifth consecutive day of notable increases. MACD prints buy signals as the 12 EMA remains on the uptrend. RSI follows a similar trend, showing a significant rise in buying pressure.
The largest memecoin will retest $0.20 in the coming days if the bulls resume the uptrend. Conversely, it risks slipping as low as $0.18 if the selling congestion worsens.
TRX/USD
A positive close at the current price will mark the coin’s second consecutive day of increases. It peaked at $0.295 a few hours ago but has since retraced and is now trading slightly lower.
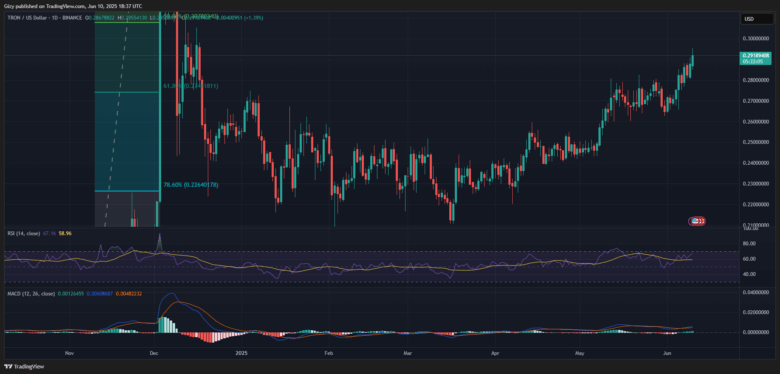
MACD prints buy signals as the 12 EMA remains on the uptrend. RSI follows a similar trend, showing a significant rise in buying pressure. This trend will result in the asset surging above $0.30 in the coming days.
Find Cryptocurrencies to Watch and Read Crypto News on the Go Follow CryptosToWatch on X (Twitter) Now
