
ETH had a few notable surges this week. However, current price action suggests that it failed to sustain the uptrend. At the time of writing, the asset is printing a red candle as selling pressure plummets.
Data from CoinMarketCap shows that the global cryptocurrency market cap is seeing a notable drop in liquidity inflow. Trading volume across the sector has since dropped by almost 9%. The platform shows that ETH is experiencing a 20% decline in buying and selling.
Most cryptocurrencies failed to impress over the last six days. The bulls show signs of exhaustion after the massive rallies two weeks ago. The fear and greed index supports this claim, dipping from 73 on Monday to its current reading of 68. Investors are becoming bearish or taking profits.
The global cryptocurrency market is taking a hit, slipping from $3.35 trillion a few days ago to $3.26 trillion. Calls of an altseason are almost silent as BTC recovers its dominance.
Nonetheless, geopolitical events failed to affect the sluggish price movement across the sector. The week started with notable bullish fundamentals. However, traders failed to respond to them. Nonetheless, there are differing opinions about the current state of the sector. Is it bullish or bearish? Let’s examine how some assets performed.
BTC/USD
Bitcoin was off to a bad start on Monday, slipping to its lowest of the week. It started the day at $104k and surged to a high of $105,706. Following the milestone, it retraced, dipping below its opening price but rebounding at $100,764.
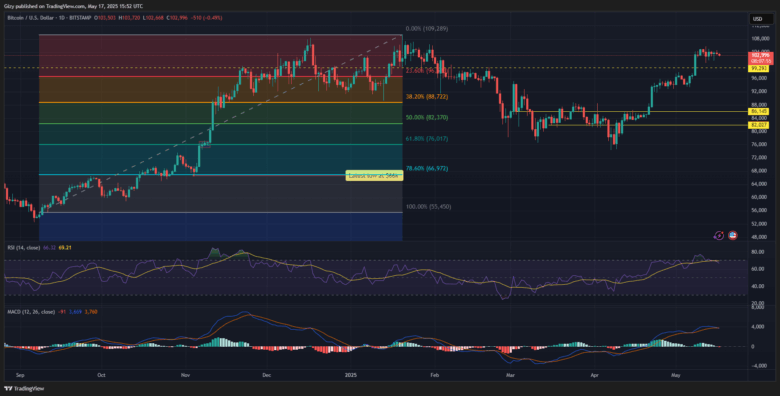
Recall that a previous analysis stated that the apex coin would see a further drop in buying volume. The predicted action is ongoing as data from Coinmarketcap indicates a 17% drop in trading volume over the last 24 hours. This is the trend every weekend.
However, the one-day chart shows other moments of significant decline in price due to a spike in selling pressure. One such event happened on Thursday when BTC broke below the $102k support. The chart shows that it dipped below it thrice in the last five days.
The asset may end the seven-day session with no significant changes in value. However, indicators are seeing a massive shift in trajectory. The relative strength index dropped below 70 on Tuesday, and selling pressure slightly increased. The metric is currently at 66.
MACD halted its uptrend a few days ago, starting a bearish convergence. A few hours ago, the 12-day EMA crossed the 26-day EMA, marking its divergence.
ETH/USD
ETH marks its fourth consecutive red candle. Its massive green candle on Tuesday was one of the week’s most talked-about events. It opened at $2,496 and surged to levels it lost in February. The altcoin opened trading at $2,495 and dipped to a low of $2,415 before rebounding. However, it surged to a high of $2,739 and closed with gains exceeding 7%.
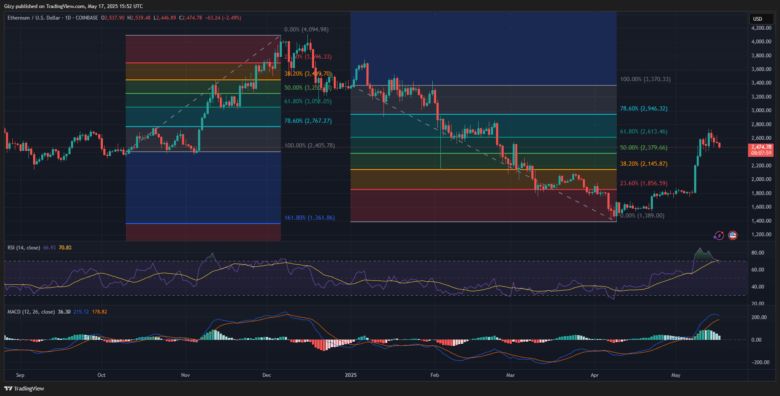
The massive green candle sparked discussion of an altseason. Current price action has since silenced this claim. Nonetheless, Tuesday’s price action marked the only green candle this week as the coin retraced afterward.
ETH may end the seven-day session with no notable price changes as it trades at its opening price. Indicators are flipping bearish following price performance over the last five days. RSI dropped below 70 following the significant rise in selling volume.
Nonetheless, many may consider the ongoing trend a healthy correction. At the time of writing, the moving average convergence divergence is printing sell signals. The 12-day EMA is heading downhill, an ongoing bearish convergence.
XRP/USD
A previous outlook pointed to a possible shift in trading conditions. XRP saw a good start to the week, printing a massive 7% candle on Monday. However, the analysis indicated a further price decline over the next few days.
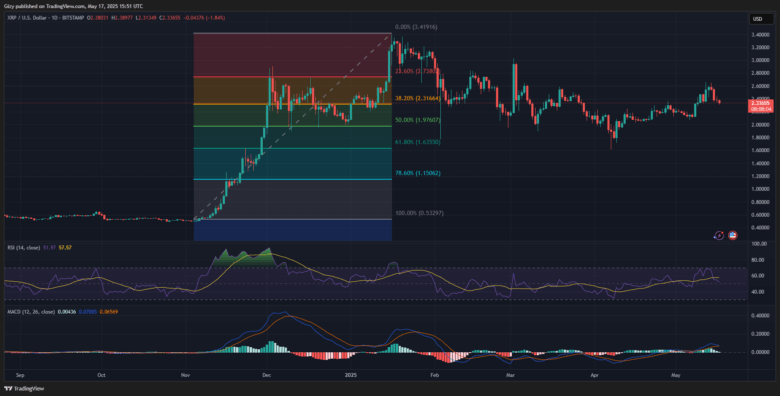
The downtrend started on Tuesday when it dipped to a low of $2.42 from $2.60. Although it recovered, it struggled to maintain the same trajectory. Its biggest decline happened on Thursday when it retraced from $2.55 to $2.35 and lost more than 6%.
Trading actions over the last 48 hours were marked by slight attempts to halt the descent. XRP printed a doji on Friday. However, it retested the $2.30 support a few hours ago but rebounded. RSI is showing no signs of a massive push from the buyers, as the metric remains at 52. Its current reading shows a spike in selling volume over the last five days.
MACD is responding to the change in trajectory. The 12-day EMA halted its uptrend and edged closer to intercepting the 26-day EMA.
BNB/USD
BNB opened trading on Monday at $650 and surged after a slight decline. It broke its two-month high and peaked as it edged closer to the $700 resistance. However, it faced massive rejections at $692 and retraced to $660.
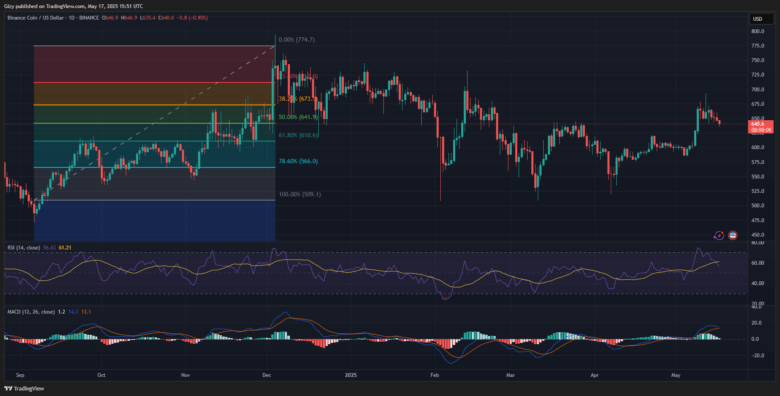
Like ETH, Tuesday was another positive period for Binance coin. However, it failed to maintain momentum, dipping to $641 after breaking $670. The one-day chart shows that the asset is yet to recover from the downtrend that started on Wednesday.
BNB is trading below the price it started the week. Current price action shows it’s edging close to retesting the $620 support.
Like ETH, several indicators are flipping bearish. Nonetheless, the most glaring is the moving average convergence divergence. The metric is close to completing a negative crossing.
SOL/USD
Solana is printing a doji following recovery from a slight decline. Current price action shows the bulls defending the $165 support. The short-term support has held out throughout the week. Nonetheless, it remains to be seen if it will last the entire session.
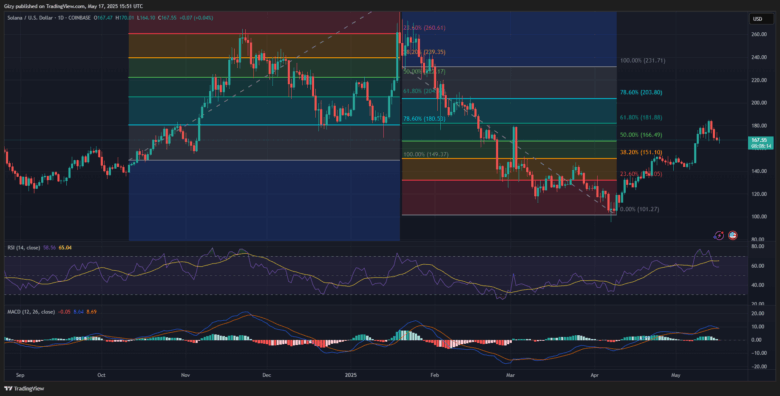
The one-day chart shows that the highlighted level was a launchpad for the massive surge the asset saw on Tuesday. SOL peaked at $184 after rebounding from the mark. However, the altcoin may end the seven-day session with a notable decline if trading conditions remain the same.
Nonetheless, MACD is on the verge of a complete bearish divergence—the consistent declines since Wednesday saw the metric halt its uptrend and flip negative. The relative strength index exhibits the same trend, dipping from 76 to 58.
Find Cryptocurrencies to Watch and Read Crypto News on the Go Follow CryptosToWatch on X (Twitter) Now
