
ADA experienced a significant change in trajectory over the last seven days. It broke out from its previous trend of little or no volatility on Monday and maintained the trend for the rest of the session.
The one-day chart shows that is currently struggling with a drop in trading volume. Data from CoinMarketCap indicates that the asset saw less buying and selling on Sunday than on Saturday. The asset reflects the dominant trend across the market as trading volume plummeted by almost 9%.
The global cryptocurrency market cap retraced from $3 trillion to $2.93 trillion at the time of writing. Investors may be exhausted from the massive rally across the sector a few days ago. The fear and greed index supports this claim as it slipped from 53 to 50 in three days.
Fundamentals became silent after the US President announced that he will not fire the Federal Reserve President. Assets like Bitcoin and Ethereum saw massive increases in response to this news, with the latter breaking above $90 for the first time in almost two months.
Other crypto assets experienced the uptrend. Solana broke above $150 but faced massive rejection at $157. TON reclaimed the $3 mark a few days ago and has since maintained trading above it.
Other cryptocurrencies in the top 20 experienced a similar price trend. Let’s take a look at them.
DOGE/USD
Dogecoin had a good start to the week, gaining almost 3% on the first day. It registered its biggest surge for the session the next day. The altcoin reached levels it hadn’t seen in nearly a month on Tuesday. It surged from $0.159 and attempted the $0.18 resistance.
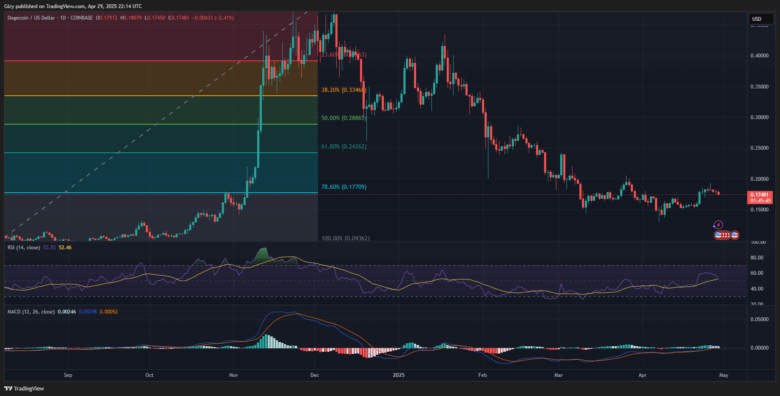
It failed to break the level but closed with gains exceeding 12%. However, this marked the end of the uptick as the asset grappled with a significant decline in buying pressure over the next few days. Nonetheless, it surged above $0.19 on Saturday for the first time in almost a month.
Price actions over the last three days shows that the altcoin is struggling to keep prices above the $0.175 mark. Previous price mark suggests that the bulls must defend this mark or risk a slip to $0.160.
Readings from most indicators are bearish. One such is the moving average convergence divergence. The metric shows the 12-day EMA halting its decline as the histogram prints smaller bars. This may mark the start of negative convergence.
The relative strength index indicates a notable increase selling pressure. The metric’s decline follows the asset’s surge above its bollinger band.
TRX/USD
Tron failed to register any significant increases on Monday. A similar event happened on Tuesday after it recovered from a slight decline. The trend continued until Friday, when it lost almost 2%. Nonetheless, it held on to the $0.24 support amid the decline.
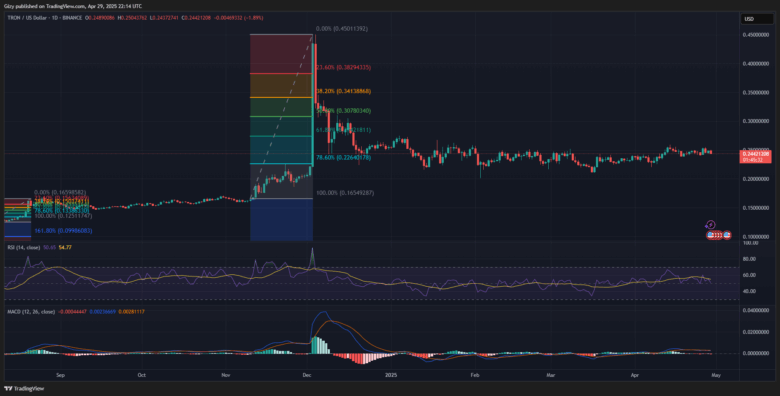
It registered a massive increase the next day, surging from $0.242 to $0.253. The altcoin closed with gains of almost 5%. However, it lost more than half the accumulated gains the next day.
The rollercoaster price movement, with no significant push to the top, keeps the asset bearish. Readings from MACD shows that it is yet to recover from the negative divergence it had a few days ago. The 12-day EMA surged higher on Friday but resumed its decline as price trajectory changed.
Nonetheless, the altcoin maintains trading above bollinger middle band. Previous price movement shows significant demand concentration around the $0.240 support. A drop in this trend may result in a slip to $0.235.
ADA/USD
The one-day chart shows Cardano is yet to register any notable increase in price over the last three days. The chart points to signs of exhaustion after a four-day uptrend that the asset saw.
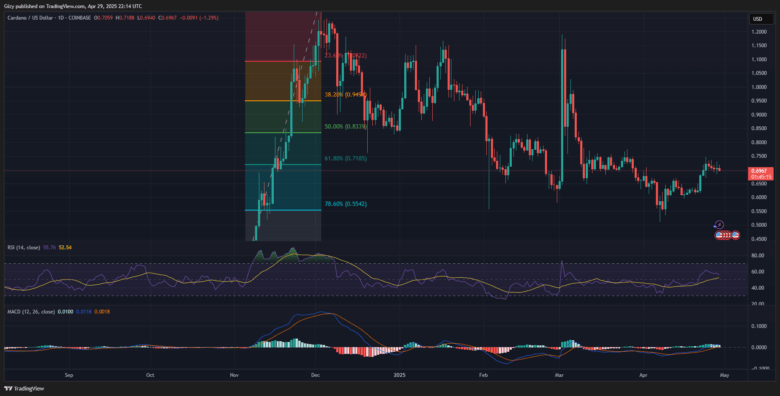
ADA was off to a good start on Monday, surging to a high of $0.65 but retracing afterwards. The asset continued its uptrend the next day, hitting a high of $0.68 for the first time in almost a month. Tuesday’s trading action was one of the biggest in weeks. It is worth noting that the altcoin closed with gains exceeding 8%.
ADA continued to rise over the next two days, gaining more than 6%. The last three days of the week were marked with low volatility. Nonetheless, it slightly declined during this period.
The moving average convergence divergence is printing sell signals. The 12-day EMA is slightly halting its uptrend as the histogram prints smaller bars. RSI is on the decline as the coin experienced further selling pressure.
LINK/USD
Chainlink had a similar price movement to ADA. It saw significant increases on Tuesday, surging from $12.8 to $141. The almost 8% increase erased the sluggish start the coin had to the session. It also saw it break above it three-week high.
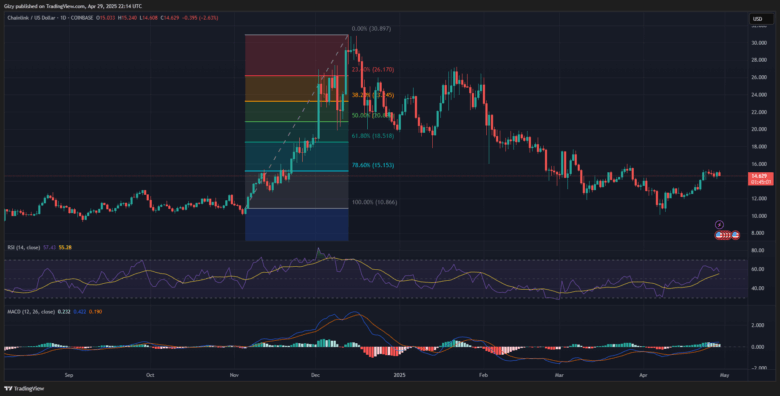
It continued the increase the next day, hitting a high of $15.3. It’s over 6% gain on Wednesday marked the end of the massive increases the asset had experienced. The following days were filled with gradual declines.
Indicators are slightly bearish in response to the recent price trend. The moving average convergence divergence is printing sell signals. The 12-day EMA is slightly halting its uptrend as the histogram prints smaller bars. RSI is on the decline as the coin experienced further selling pressure.
Find Cryptocurrencies to Watch and Read Crypto News on the Go Follow CryptosToWatch on X (Twitter) Now
