SOL is the second top gainer in the top 10 in the last 24 hours. The asset broke above another critical mark as buying pressure increased. Data from CoinMarketCap shows that it saw a more than 15% increase in trading volume during this period.
SOL maintains its upward trajectory and may continue as trading conditions improve. One of the most significant signs of a shift in sentiment is the Fear and Greed Index. The metric hovered around 32 towards the end of the previous week. However, it’s at 52 as investors become more bullish.
The global cryptocurrency market cap surged on Tuesday, as did several cryptocurrencies. The valuation was above $2.90 trillion but nears $2.95 trillion at the time of writing. It’s worth noting that trading volume is not as high as many people expect. This may be a sign of growing exhaustion after the massive spike in liquidity during the previous intraday session.
Nonetheless, several altcoins are on the verge of breaking above critical levels. One of the biggest gainers in the last 24 hours is TRUMP. The memecoin gained a whopping 53% as it broke above $1 for the first time after its free fall in the first week of March.
The reason for the sudden shift in traders is not a mystery. Fundamentals improved over the last two days. However, some assets in the top 10 are showing signs of slowing down. Let’s examine them.
BTC/USD
Bitcoin is struggling to continue its uptick as the bulls show signs of exhaustion. A few hours ago, the asset peaked at $94,700 but retraced, hitting a low of $71,970. Its current price suggests that it recovered. However, it prints a doji at the time of writing.
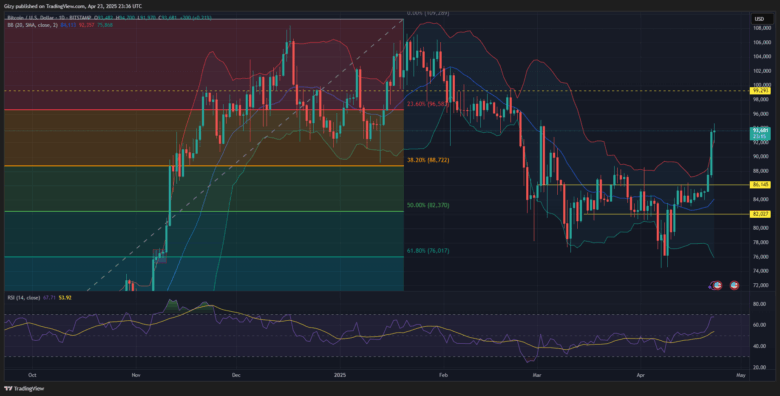
The most recent price trend follows the massive increase the asset enjoyed on Tuesday. It surged from $87,505 and broke the $90k resistance for the first time since Mar. 6. The milestone sparked a lot of reaction from investors who predict a surge to $100k next.
Nonetheless, the one-day chart shows the asset is trading above the bollinger bands. It tested the metric on Monday as it gained almost 3%. However, the breakout happened the next day, following its surge above $90,000.
The price hike was due to a spike in buying volume. RSI peaked at 67 in response to this trend, the highest since December. Nonetheless, the moving average convergence divergence broke above zero, indicating that the bulls are in control.
ETH/USD
Ethereum surged to a high of $1,658 on Monday but retraced. It ended the day at its opening price. However, on Tuesday, the asset broke its seven-day trend of little to no volatility. It broke above the $1,700 resistance for the first time in over 14 days. It edged closer to breaking $1,800 but experienced significant selling pressure at $1,778.
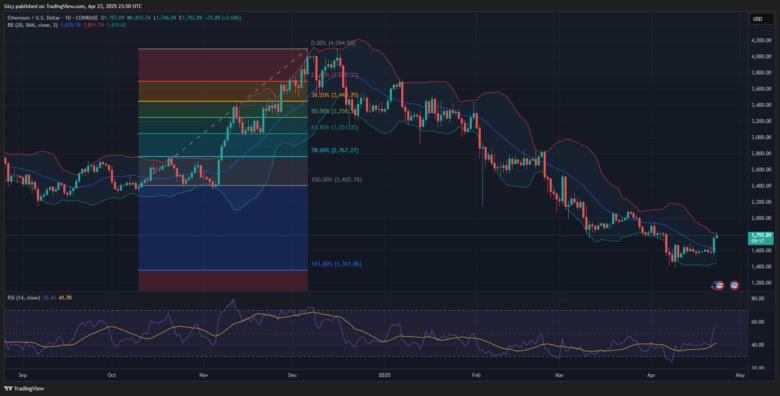
The largest altcoin continued its uptick on Wednesday, breaking the highlighted mark and peaking at $1,835. It retraced and trades lower than its high. However, it remains over 2% higher than it was at the start of the day.
The relative strength index indicates that the asset is not experiencing as much buying pressure as it did the previous day. Nonetheless, the metric is at 55 for the first time since December. The sudden spike in buying volume saw prices shoot up, breaking the bollinger bands.
Nonetheless, the asset trades above a critical support; the $1,750. Previous price movement suggests that a slip below this mark may send ETH below $1,600.
XRP/USD
Like SOL, XRP broke above a key level on Tuesday. It surged from $2.08 and broke above $2.20. The coin closed with gains of more than 6%. Its trading action during the session overturned the sluggish start it had on Monday.
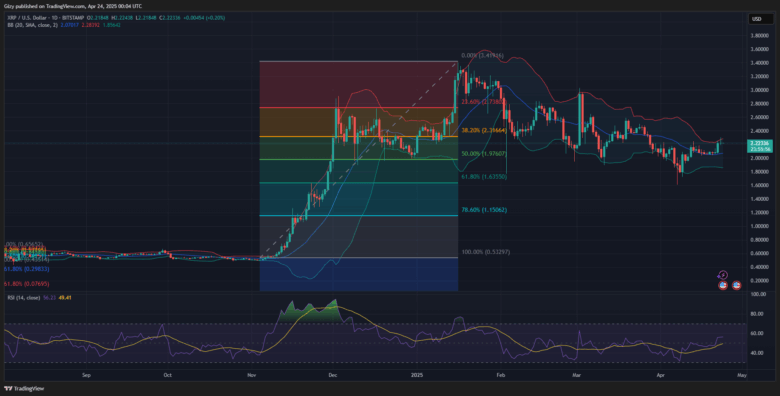
However, it is struggling to continue the uptrend. The coin briefly broke above its bollinger bands a few hours ago as it surged to a high of $2.30. It lost momentum and plummeted. It trades at its opening price as the bulls show signs of exhaustion.
This may be the case, as data from CoinMarketCap shows a 23% increase in trading volume. Price action suggests that the bears may be edging at the time of writing. Nonetheless, the moving average convergence divergence remains positive, continuing to surge higher.
The relative strength index captured the sudden volume change, displaying a signal that suggests that the bulls and bears are exerting almost equal pressure. It is also worth noting that the asset is trading around a critical support; the $2.20. Previous price movement suggests a slip to $2 if it breaks.
BNB/USD
Binance coin saw a trend reversal to its bullish performance from the previous day. Tuesday was a notably positive day for most assets. Cryptocurrencies like SOL and BNB saw massive increases during this period, with the latter surging from $597 to break the $620 resistance for the first time since March.
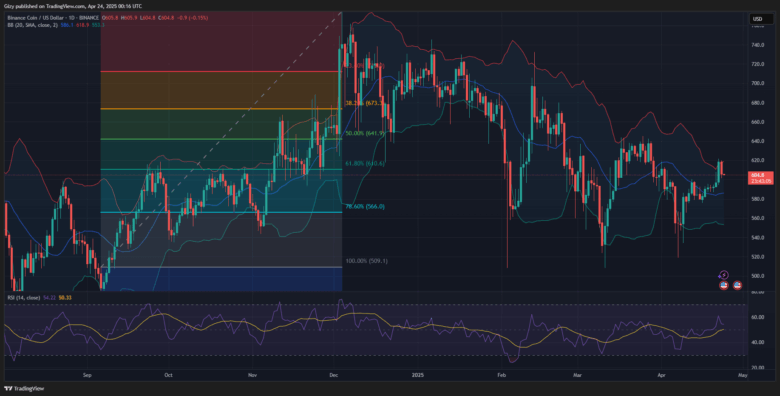
The surge above this critical mark triggered an unexpected result: a significant selloff. The altcoin retraced to a low of $601 on Wednesday and lost more than half of the gains it accumulated during the previous intraday session.
BNB’s surge above the bollinger band may be a signal for a reversal, as such a trend typically indicates a peak in the uptrend. Nonetheless, it trades within the upper and middle SMA, which is positive for the asset. However, RSI shows a massive increase in selling pressure.
The bulls need to defend the $600 support, as previous price movement suggests a possible decline to $585 if it breaks.
SOL/USD
Solana briefly broke above its bollinger band a few hours ago. It surged to a high of $154 but retraced. The latest price movement suggests that the asset is struggling to continue the previous day’s price trend as it lost momentum.
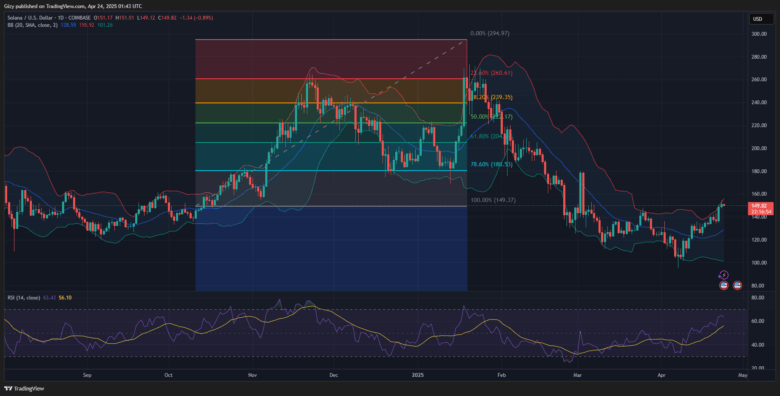
SOL broke the $150 mark on Tuesday, surging from $136 to $150. Although it saw a slight decline after it peaked, it closed with gains of 9%.
Indicators continue printing green signals amid the current price trend. The relative strength index indicates that the asset is not experiencing as much buying pressure as it did the previous day. Nonetheless, the metric is at 64 for the first time since January.
Find Cryptocurrencies to Watch and Read Crypto News on the Go Follow CryptosToWatch on X (Twitter) Now
