
TON saw a massive decline on Monday, plummeting despite the slight improvement in fundamentals. The asset is on the verge of losing all the gains it accumulated last week, sinking closer to its lows.
However, TON’s price action is not an isolated incident, as several cryptocurrencies in the top 100 are also down. Onyxcoin dropped from its peak of $0.018 to $0.016, down by almost 5%. FTM surged to a high of $0.50 but retraced and is trading at $0.45 at the time of writing.
Nonetheless, these assets’ performance barely affects the global cryptocurrency market cap, which is worth $2.73 trillion. The sector saw a significant increase in trading volume, up 90% from the previous day.
Further drama in the US may be the catalyst for massive breakouts this week. During the previous seven-day session, the President announced his desire to fire the Federal Reserve head, stating it can’t happen “fast enough.”
On Monday, Donald Trump directed the Federal Reserve to cut interest rates. While Jerome Powell expressed that he won’t leave the office, consistent threats from POTUS may be getting to him. Investors believe the chairperson will likely gain a little favor by doing what was instructed.
The crypto market will surge on prospects of a rate cut. Let’s see how some assets perform.
Top Five Cryptocurrencies
BTC/USD
Data from CryptoQuant shows that exchange reserves are declining as buying activity continues. Another contributing factor to this trend is the massive outflows these platforms are seeing. Investors are moving more assets into cold storage.
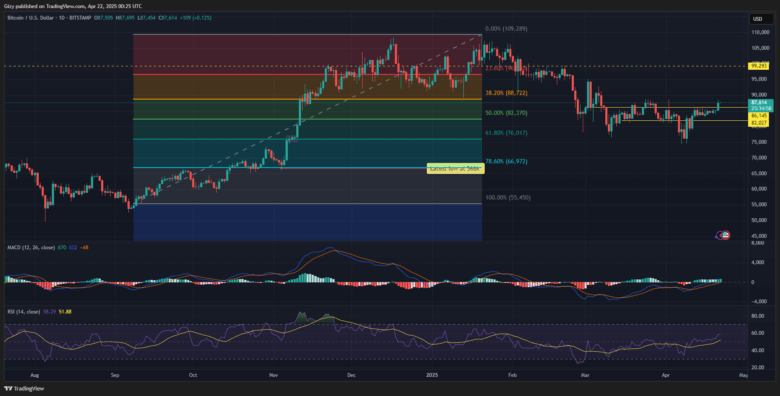
The reading from on-chain indicators explains the reason for the ongoing price increase. BTC opened trading at $85,197, surged, and broke above the $ 87,000 resistance for the first time in the last 14 days. It continued upwards, peaking at $88,527 before retracing.
The latest price action is a significant shift from the previous price trend. Bitcoin failed to retest key barriers as it saw low volatility last week due to low trading volume. Data from CoinMarketCap indicates that the asset saw a more than 140% increase in buying and selling volume over the past 24 hours.
The moving average convergence divergence shows that the asset may continue its upticks as the metric soars. The relative strength index registered a spike in buying pressure that may play a massive role in price actions this week. BTC may retest $90,000 if the bulls maintain their current momentum.
ETH/USD
Ethereum experienced a notable price increase a few hours ago. It surged to a high of $1,658 after opening at $1,587. However, the asset retraced and returned to its opening price. Currently, the coin is printing a red candle and is on the verge of registering its second consecutive loss.
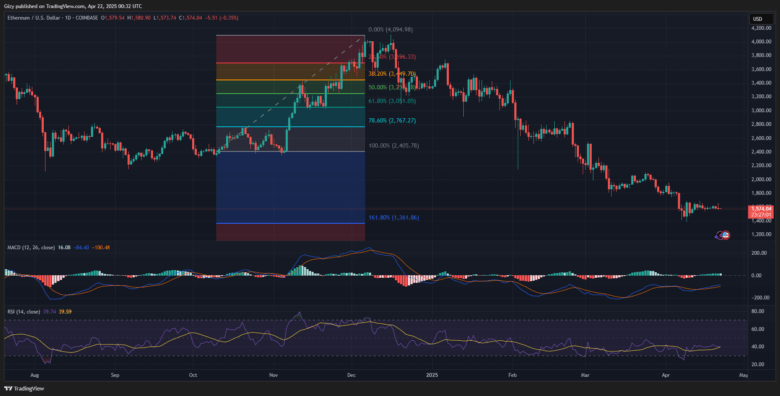
Although not significantly down, the latest price action is due to investors’ lack of confidence in ETH. At the time of writing, it is seeing notable selling pressure. Exchange reserves are growing, continuing their seven-day trend. These trading platforms are seeing more inflows from cold storage, which outweigh the outflows.
Like TON, Ethereum is seeing a gradual shift in traders’ sentiment. At the time of writing, MACD prints bearish signals. A close look at the metric shows the 12-day EMA and 26-day EMA surging. However, the histogram displays a smaller bar, which may hint at a dwindle in the bullish momentum.
Further declines may see the largest altcoin retest the $1,500 support. However, a shift in fundamentals may send it as high as $1,700.
TON/USD
Toncoin may end Monday as one of the top losers in the top 20. It surged to a high of $3.05 a few hours ago but lost momentum and retraced to its opening price. Trading at $2.88, the asset is almost 4% lower than it started the day.
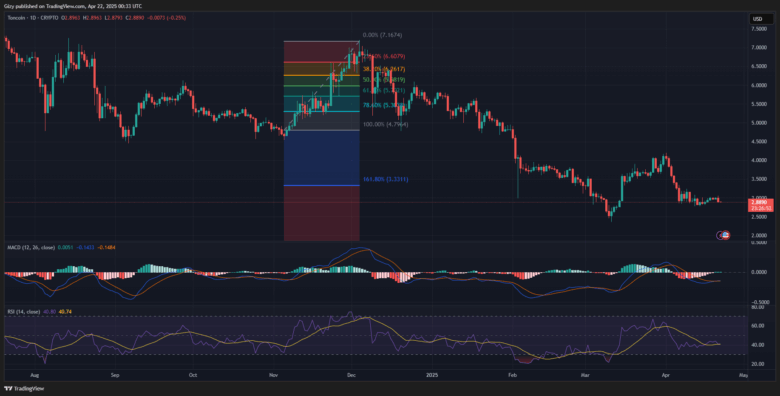
TON’s latest price indicates that it wiped off its four-day gain and is edging closer to the previous week’s low. The altcoin may recover within six days as indicators are slightly bullish.
The moving average convergence divergence prints positive signals at the time of writing. The 12-day EMA intercepted the 26-day EMA from below, completing the bullish convergence. A divergence is underway amid the ongoing price trend.
Nonetheless, MACD’s reading may mean an impending increase for the asset. Previous movements suggest that TON may rebound on Tuesday. It is trading at a level with significant demand concentration. It may surge from this mark, reclaiming $3.
However, a slip below the $2.80 support may see TON retest $2.50.
SUI/USD
Sui experienced its first notable price change in the last five days. It surged to a high of $2.28 on Monday from $2.10. Although it retraced to $2.20, it is up by almost 4%.
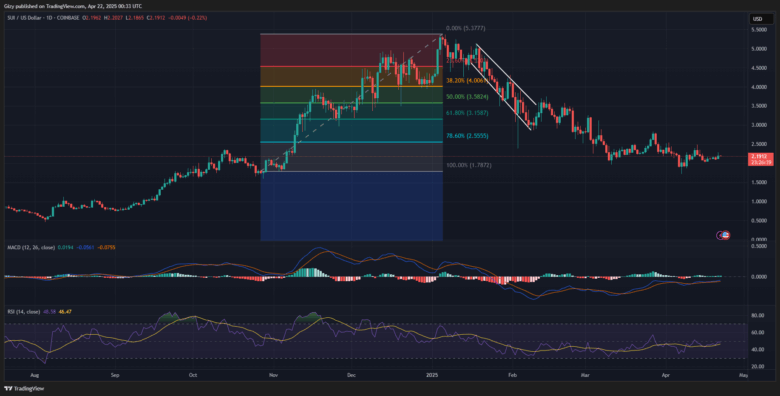
The latest increase may mark the start of a further price surge this week. The bulls will look to extend the uptick following price actions over the last seven days.
MACD supports the assertion that the coin may experience further increase within the next six days. The metric continued upward since its bullish divergence over the last two weeks. The relative strength index is on the rise as buying pressure spiked.
If this indicator’s reading holds, SUI may surge as high as $2.50. Nonetheless, a change in trading volume may cause the asset to slip by $2.
STX/USD
Stacks is closing its fifth day of consecutive increases. Monday’s price action is the biggest in this run, as the asset is up by a whopping 10%. It surged from $0.63 to a high of $0.72.
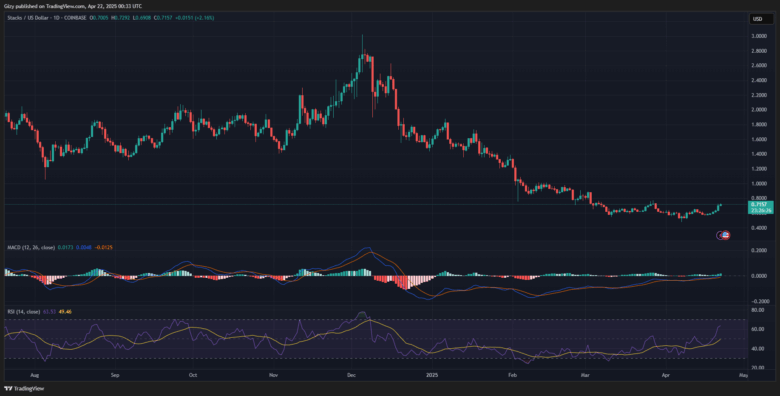
RSI is at 61, indicating room for further surge. The MACD is positive, as it has shown a bullish divergence over the last two weeks and has continued to move upward. Based on these readings, the asset may retest $0.80 this week.
However, it risks losing momentum. This may send it as low as $0.60.
Find Cryptocurrencies to Watch and Read Crypto News on the Go Follow CryptosToWatch on X (Twitter) Now
