
ETH continues its rangebound movement, resulting in its failure to break above the $2,800 resistance. It grapples with significant selling pressure after breaking the mark.
ETH is on the rise as trading conditions improve across the crypto market. It edges closer to erasing Friday’s losses and sees notable buying pressure to aid its recovery.
The global cryptocurrency market cap gained over 3% in the last 24 hours, with the trading volume declining further. With the buying and selling pressure down by over 41%, price action suggests fewer sellers at the time of writing.
Cryptocurrencies like SEI and WIF are seeing notable increases. SEI opened the day at $0.25 and surged as buying volume spiked. It trades at $0.28 after breaking above its fourteen-day high. It is up by over 10% amid slight declines.
Dogwifhat returns to its uptick after the previous day’s abruptly ended. The memecoin peaked at $0.72 but retraced to a close below its opening price. Its latest increases see it edge closer to the previous day’s high. Its 10% increase could indicate the asset is gearing up for a major surge as indicators are green.
The slight recovery in the value of most cryptocurrencies in the top 100 shows a softening bearish stance. Let’s see how they are performing.
BTC/USD
Data from CryptoQuant indicates an ongoing bullish attempt to push prices higher. The platform shows a decline in exchange reserves in the last 24 hours. Currently, down by 0.39 on Friday, the drop is not an isolated case. This is the same trend over the last seven days.
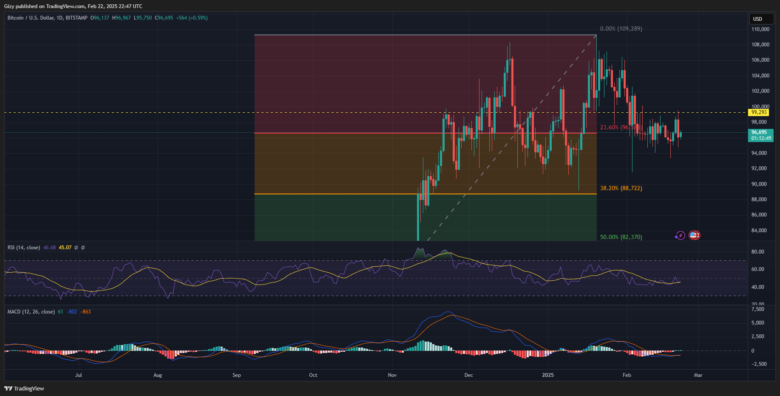
Traders are moving more assets off trading platforms. The exchange netflow is negative 43% at the time of writing. The coin sees significant buying pressure from the whales and US investors as the Coinbase premium is positive, indicating more buying pressure.
The one-day chart shows that the apex coin remains within its rangebound movement. The current session marks the coin’s second week below $100k. It edged closer to breaking above the mark during the previous intraday session but failed due to significant selling congestion at $99,500.
Bitcoin registers yet another doji on the weekly scale as it failed to surge. The moving average convergence prints buy signals. However, previous trends suggest that the bullish interception may result in a massive price surge.
ETH/USD
Ethereum is seeing notable buying pressure at the time of writing as it holds prices higher than they were when the day began. The largest altcoin opened Friday trading at $2,661 and continued upward after a slight decline. It peaked at $3, shy of breaking above $2,8000. Nonetheless, it is currently up by over 4%.
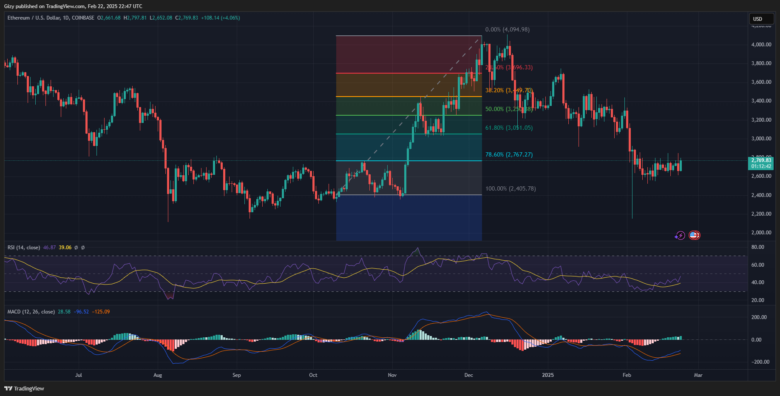
ETH is seeing a significant increase in assets leaving exchanges. Although exchange reserves are increasing, the NetFlow total is negative 157%. However, network activity significantly declined in the last 24 hours, with a 33% dip in active addresses and a 34% decrease in transactions.
The largest altcoin is up by over 4% on the weekly scale. This marks the first significant green for the first week of January. Indicators like MACD and the relative strength index are positive. A look at RSI shows a gradual climbing trend, indicating a steady increase in buying pressure.
ETH had a positive divergence a few days ago, and the 12-day EMA continued upward.
XRP/USD
XRP prints its first green candle after two days of significant decline. However, it is not significantly higher than its opening price as it grapples with notable selling pressure and prints a doji.
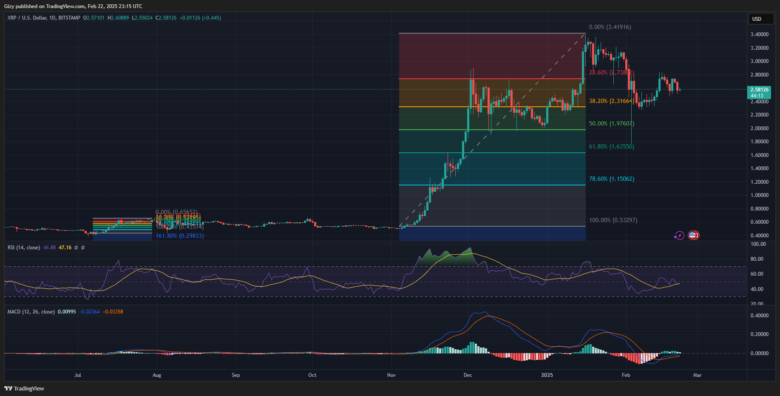
It had one of its biggest declines during the previous intraday session. It dipped from $2.68 to a low of $2.50 before rebounding. Nonetheless, it closed with losses exceeding 4%.
The latest halt to its downward movement barely affected the trajectory of some indicators. Although RSI halted its decline, it’s still pointed downwards.
Readings from the moving average convergence display an ongoing bearish convergence. If the downtrend extends, the 12-day EMA will continue downward and may intercept the 26-day EMA in the coming days.
BNB/USD
Binance coins saw a spike in buying volume a few hours ago. The latest change in sentiment comes after a significant decline on Friday. The coin retraced from $668 to a low of $634 but rebounded.
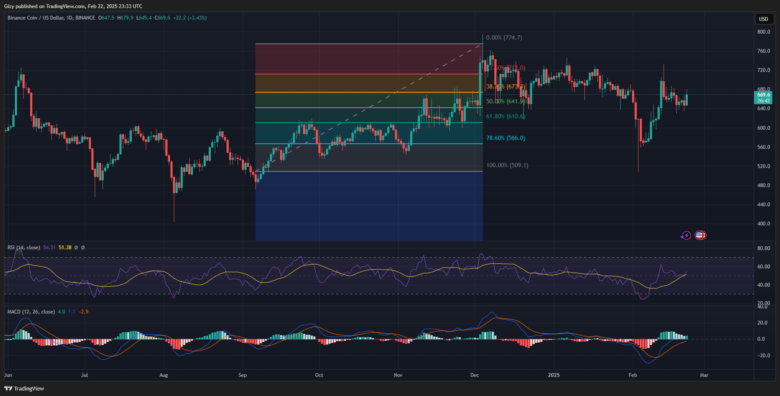
BNB opened Saturday at $647 and peaked at $679. The asset retraced after hitting the mark and trades at $669. Currently up by over 3%, RSI is back on the uptrend in response to the spike in buying volume.
The increase halted the trajectory of the 12-day EMA. MACD displayed a negative convergence during the previous intraday session, with the shorter-time-frame EMA edging downwards. The decline ended a few hours ago, and both EMAs are on the uptrend.
SOL/USD
SOL resumes its uptrend after the previous day’s decline. However, the change in price trajectory did not affect the moving average convergence divergence. The 12-day EMA continues downward, and the 26-day EMA mirrors the same trend.
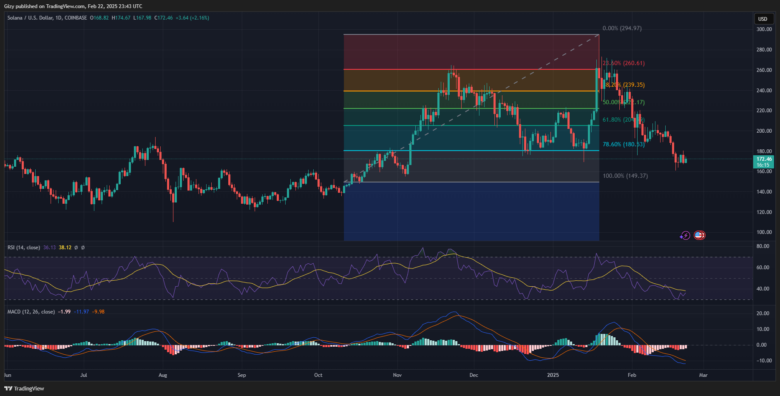
Nonetheless, the relative strength index rose in response to the slight increase in buying volume. The altcoin opened the day at $168 and surged to a high of $174 but trades at $172 at the time of writing.
The coin still grapples with notable selling pressure as it failed to erase the previous day’s losses. Nonetheless, the asset trades close to its 78% fib level. Traders anticipate another flip of the $180 reistance again.
DOGE/USD
Dogecoin is up by over 3%. It started Saturday at $0.239 and peaked at $0.247 after a slight decline. The latest price change altered the trajectory across several indicators.
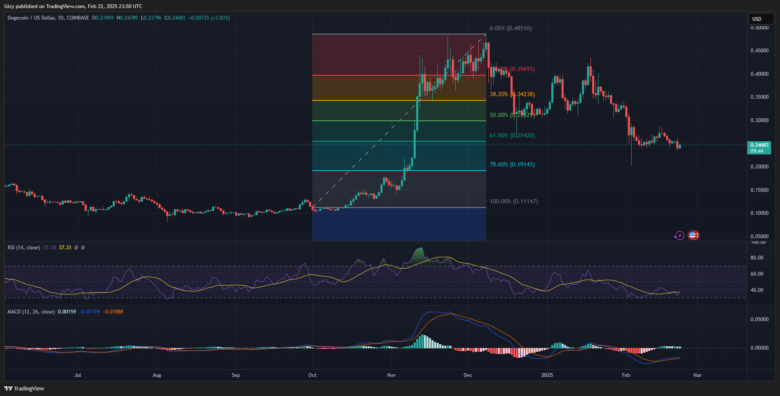
RSI is back on the uptrend in response to the spike in buying volume, which halted the trajectory of the 12-day EMA. MACD displayed a negative convergence during the previous intraday session, with the shorter-time-frame EMA edging downwards. The decline ended a few hours ago, and both EMAs are on the uptrend.
It’s worth noting that DOGE trades close to its 61% Fib level. The coin grappled with notable selling pressure at this mark.
Find Cryptocurrencies to Watch and Read Crypto News on the Go Follow CryptosToWatch on X (Twitter) Now
